The Web 2.0 Points of Control Map
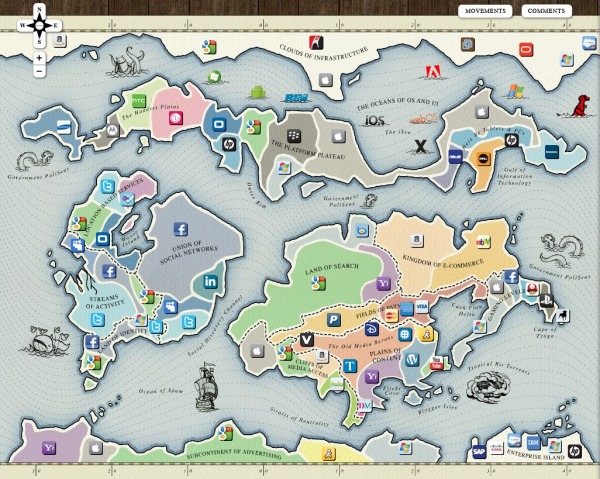
The Web 2.0 Summit Points of Control Map is a very cool, interactive map. As part of the marketing for the upcoming Web 2.0 Summit (November 15-17 in San Francisco) they have released this interactive map that takes the metaphor of web companies/brands as countries on a map (from xkcd.com and flowtown.com) to a new level.
Pan and Zoom to explore the map, and click the icons to get some insight about each player and their position.
Then, turn on the comments view to discuss the map with others and add your own ideas!
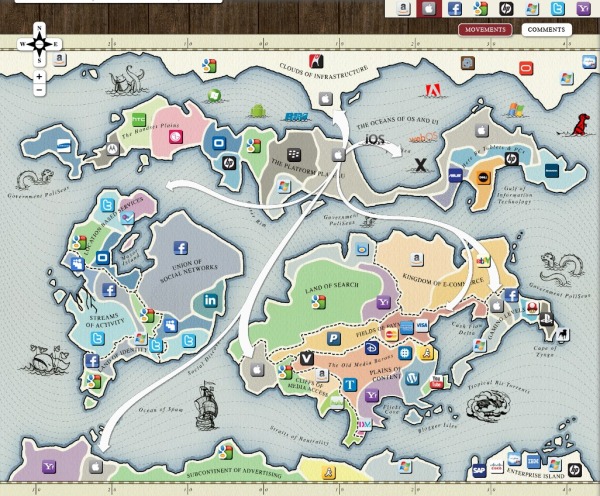
By clicking on any of the company icons at the top, arrows are shown to indicate the business areas (continents) that the companies are trying to expand into (colonize). You can turn them on one at a time, or turn many of them on at the same time.
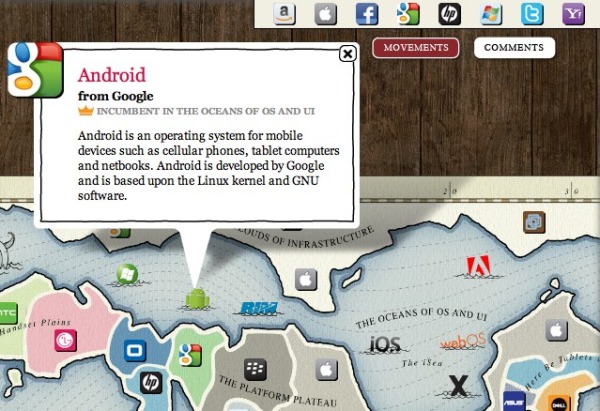
Additionally, you can select any individual icon to get more details:
John Battelle has an in-depth post on the Web 2.0 Summit blog, Points of Control: The Map, about the creation of the map, and his hope that others will add to it in the future.
We’ve put the entire map under a Creative Commons Attribution-NonCommercial-ShareAlike 3.0 Unported License, which means we want you to take this idea and add to it, making it better. Once our amazing development partners at Blend Interactive catch their breath, we also plan to release the code and documentation, so you can create your own maps as well.
Our thanks to the team at Blend who worked with me to bring this vision to reality, and to Janetti Chon, my producer, who kept it on track, and the entire team at Web 2.0 for bearing with us as we brought this first iteration to fruition.
Found on VizWorld.com and VizThink.com
 brand,
  corporations,
  internet,
  map,
map,  social,
  social media,
  web
web 


