How Google Glass Works
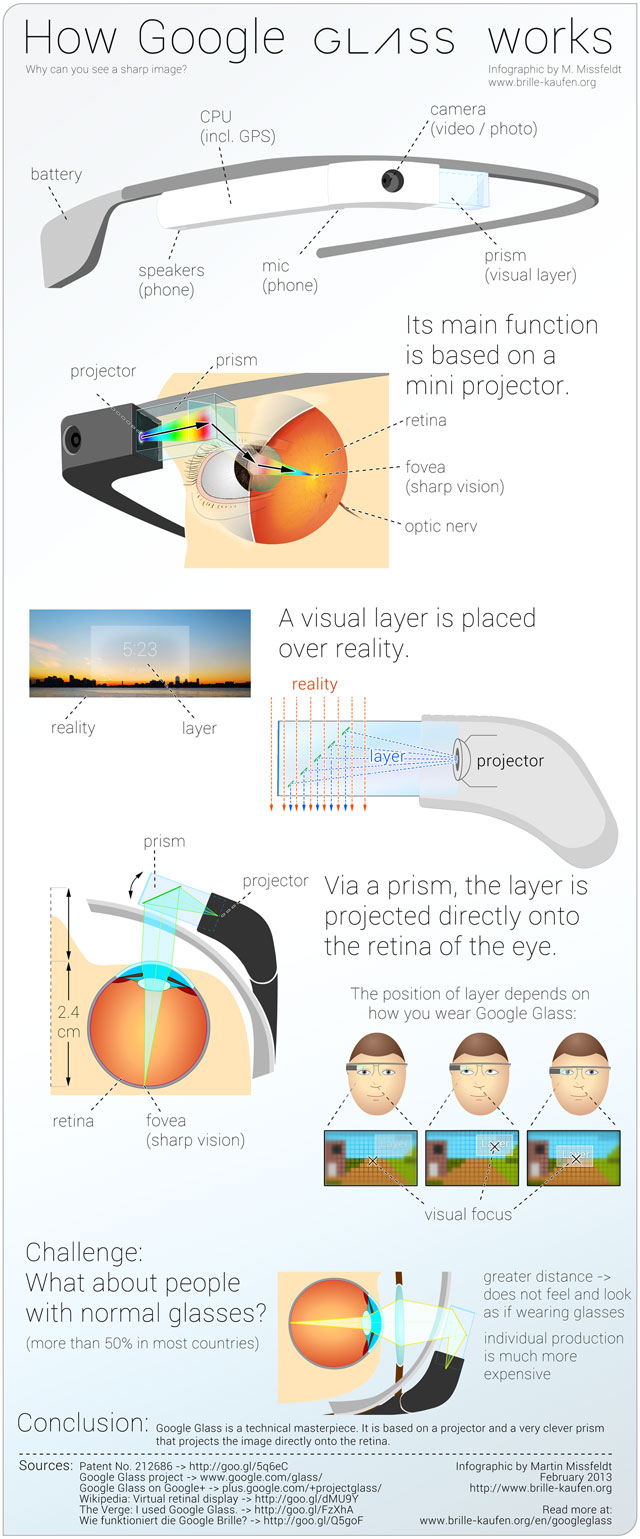
The Google Glass phenomenon has gotten a ton of coverage from the tech press, but how does it work? Creator Martin Missfeldt explains the inner workings in his How Google Glass Works infographic.
How does it work, Google’s new Glass? Why can you see with it a sharp image-layer? How does the image overlay the image of reality? The following infographic illustrates the optical principle - very simple and easy to understand.
Google Glass is a technical masterpiece. It combines numerous functions and features in a very small unit. In addition to phone and camera (photo, video), it offers Internet connection, including GPS.
The core feature of Google Glass is a visual layer that is placed over the reality (“augmented reality”). This layer opens a door to amazing new possibilities. But how does it work? In the Google Glass contains a mini-projector, which projected the layer via a clever, semi-transparent prism directly on the retina in the eye. Because of this the image, even though it is so close to the eye, is sharp and clear. You can move the front part of the Google Glass easily to optimize the focus.
This informative infographic is a great how-to explanation of the science and technology built into Google Glass. Illustrations and images are used in this design to tell the story instead of data visualizations.
A German version of the infographic was also published.
Found on http://www.educatorstechnology.com/2013/05/a-great-visual-guide-on-how-google.html


 Randy
Randy


Reader Comments (2)