About
Randy Krum
President of InfoNewt.
Data Visualization and Infographic Design

Infographic Design

Infographics Design | Presentations
Consulting | Data Visualizations

DFW DataViz Meetup

Join the DFW Data Visualization and Infographics Meetup Group if you're in the Dallas/Fort Worth area!

Search the Cool Infographics site

Custom Search

Subscriptions:


Feedburner

The Cool Infographics® Gallery:

How to add the
Cool Infographics button to your:

Cool Infographics iOS icon

- iPhone
- iPad
- iPod Touch


Read on Flipboard for iPad and iPhone

Featured in the Tech & Science category

Flipboard icon

Twitter Feed
From the Bookstore

Caffeine Poster

The Caffeine Poster infographic

Entries in technology (26)

Friday
Mar082013

Shutterstock: Annual Design Trends 2013 Edition

Shutterstock: Annual Design Trends 2013 Edition infographic

Shutterstock has created their Shutterstock: Annual Design Trends 2013 Edition infographic. From the infographic, we learn what was hot in 2012, as well as expected trend for the coming year of 2013. Interesting fact: Infographic downloads from Shutterstock are up 525% from 2011! 

Here at Shutterstock, if there’s one thing we obsess over as much as inspiring imagery, it’s data. Add that to the fact that we license more images than anyone else, and you have a recipe for some pretty insightful trend forecasting.

We created our first design-trends infographic last year; this time, we took things up a notch, incorporating a lot more data, a lot more images, and a more in-depth look at what we see heating up in the year ahead.


Check out the full infographic, then read on for 10 of our own favorite takeaways.

The use of stock vectors, especially for data visualizations, is on a huge upward trend as more and more people are designing their own infographics and data visualizations.  I am very excited about this trend, as people are breaking away from the chart templates in MS Office to visualize their new data in new and different ways.

I would prefer to see all of the statistics visualized using the stock vector data visualizations from Shutterstock.  That would have been more in line with the growth trend they are showing.  Much better than just showing the numbers in text they way they have in this design.

The footer of the infographic is missing both a copyright statement (or Creative Commons license), and the URL directly to the blog post with the high-resolution infographic.  The URL they did include is just to the main blog page, and six months from now the infographic will be buried in the past blog posts.

Thanks to Danny for sending in the link!

Monday
Jan072013

Can You Protect Yourself from Hackers at CES?

Can You Protect Yourself from Hackers at CES? infographic

Are you headed to CES in Las Vegas this week?  Do you know how to protect your electronic devices?  The Is Your Device Safe at CES? infographic from Novell shows us some heartbreaking stats.

The Numbers Don’t Lie

You don’t think it will ever happen to you, do you? Well, think again. With a laptop or tablet being stolen every 53 seconds you can literally lose your mobile device at any minute. Oh, and by the way, you’re losing a lot more than that precious device: sensitive company documents, passwords, credit card information, etc. So what are you doing to protect that phone/iPad/laptop? Apparently very little as only 4% of smartphones have Mobile Device Management security installed on them. Take a look at a few of the scary numbers and some ideas you could implement to protect your device and your precious content.

This design is long, but there’s a lot of information to share.  I like the simple color scheme, and there’s some really good data included in here.  However, most of the statistics are shown in text only, which is disappointing.

I’ve said it many times here on Cool Infographics.  Big fonts are not data visualizations.  You want your readers to comprehend and remember the numbers you are showing them in your infographic design.  To be successful at that you need to put the numbers into context for the reader, by visually comparing them to another value or showing them the scale of the value.

Thanks to Mat for sending in the link!


Monday
Jan072013

Tomorrow's World

Tomorrow's World infographic

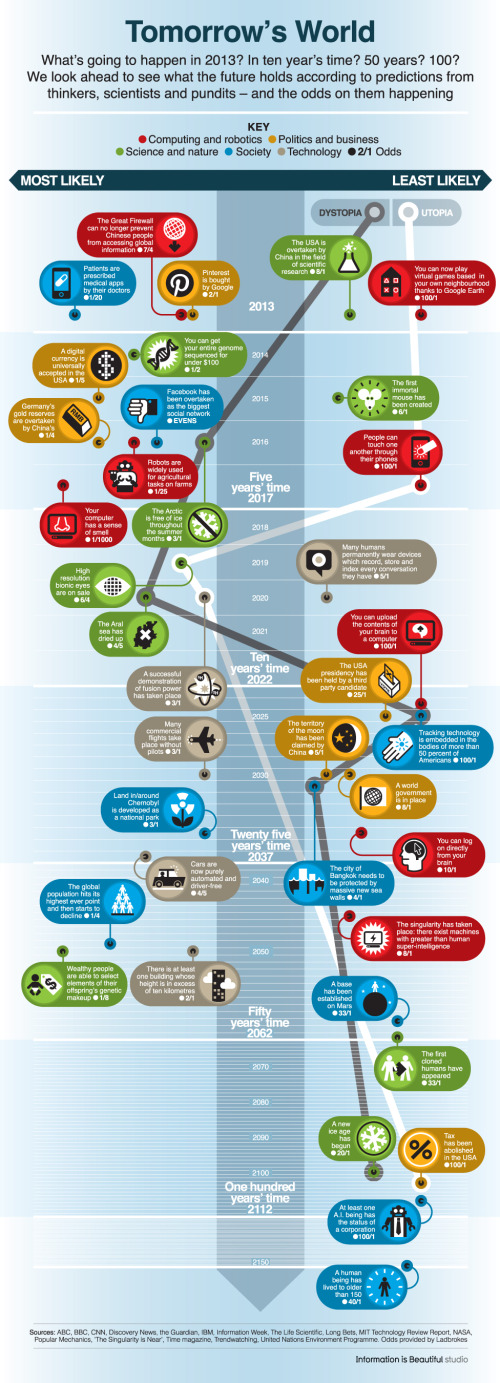
Tomorrow’s World infographic from the BBC maps out many of the future predictions from experts onto a timeline of the next 100 years, and lays out odds on how likely each prediction may come true.

As we begin a new year, BBC Future has compiled 40 intriguing predictions made by scientists, politicians, journalists, bloggers and other assorted pundits in recent years about the shape of the world from 2013 to 2150.

They range from the serious to the fanciful, from the exciting to the petrifying.

And to get a gauge on how likely they are to happen, we asked the special bets department at British betting firm Ladbrokes to give us their odds on each prediction coming true.

The predictions are color-coded by category, placed along the timeline and finally shown in the horizontal direction based on the odds.  This is a really good design, and I like the custom icons for each prediction.

Found on CNET thanks to a Tweet from Dave (@Drodgerson)!

Monday
Dec242012

Defending the Death Star

Defending the Death Star with A little Data Center Design infographic

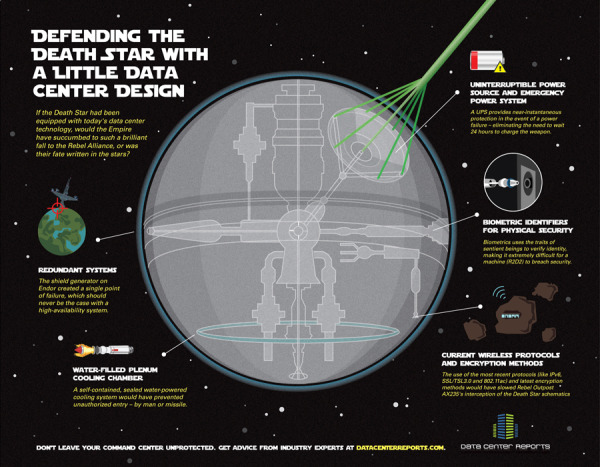
Old age meets new age. Defending the Death Star with A little Data Center Design takes a concept that people can relate to (Star Wars) and applies modern day data center technologies. Brought to you by Data Center Reports.

When Aristotle first explained the concept of “hamartia” in Poetics, he probably didn’t know just how many hero and villain stories would be driven forward by fatal flaws in character, judgment or planning. The Star Wars saga is an epic tale that is powered by fatal flaws – yet we couldn’t help but wonder how things might have turned out had the Empire used a little of today’s security insights to better protect the superweapon better known as the Death Star.

This infographic design tells a good story with illustrations.  No big data sets to visualize, but a simple story that’s incredibly easy for the reader to understand.  The Star Wars comparison puts the different technologies into context for the reader.

The footer should include a copyright and the URL link to the original infographic so readers can easily find the original high-resolution version.

Found on Data Center Reports

Wednesday
Oct312012

60th Anniversary of the Bar Code

60th Anniversary of the Bar Code infographic

Wow!  This year is the 60th Anniversary of the Bar Code, and I remember when checkout clerks at the grocery store had to key in every price!  OK, I only barely remember that as a kid.

The barcode is a fundamental part of how we obtain goods—from scanning items for price comparisons, adding goods to a wish lists and checking out purchased products. We use barcode scanners on a daily basis, but have you ever asked yourself how the barcode came to be? Would you believe that the first barcode was printed on a pack of Wrigley’s gum, and originally created to help grocery stores track inventory? 

Today is the 60th Anniversary of the barcode; and if you’re interested in learning more fun facts like the ones above as well as how the barcode came to be, its practical uses, and how industries have implemented the technology today, check out the infographic below.

Even without any data visualizations, this design does a good job of leading the readers through a short history, and visually shows the reader the different types of bar code technologies and bar readers.

In the footer, the design is missing both a copyright statement, and a URL to help the readers find the original full-size version on Wasp Bar Code’s landing page.  They include the home page URL, but a reader won’t find any mention of the infographic on the home page.

Thanks to David for sending in the link!

Tuesday
Sep182012

How Does A Touchscreen Phone Work?

How Does A Touchscreen Phone Work? infographic

This is the reason why your iPhone won’t work with gloves but your Samsung U600 will! The How Does A Touchscreen Phone Work? infographic from mycricket.com compares phones with the three different types of touch screens. 

Ever wonder why some touch screen phones cost more than others? Or why you can’t seem to get the touch screen on your smartphone to work if you’re wearing a glove? Most people don’t know that there are three different types of touch screen technologies available: resistive, capacitive, and infrared. Learn about the different benefits and capabilities to make sure you get the touch screen phone you’re looking for.

This is a really good comparison infographic design.  Each feature is clearly illustrated for the reader, the text descriptions are minimal and it’s very easy to read top-to-bottom.

I had trouble finding the original because the URL link to the original landing page was not included at the bottom of the design (always include the URL!), and there should be some type of copyright or Creative Common license.  Not really a problem, but I’m surprised the design doesn’t include any mention of the Cricket Wireless brand or logo.

Thanks to Sam for sending in the link!

Monday
Sep102012

BYOD: The Good, the Bad and the Ugly

 BYOD: The Good the Bad the Ugly infographic

“BYOD” Bring Your own Device. A great idea that can easily turn messy. Biztech has introduced the BYOD: The Good, the Bad and the Ugly infographic asking you to answer 6 easy but important questions before you launch into a BYOD situation. 

If your company is considering allowing employees to bring their own devices to work, make sure you have a game plan in place.

BYOD has freed up many enterprises from the responsibility of exclusively purchasing and maintaining computing devices, such as notebooks, tablets and smartphones, but companies still need to have policies set in place to make things work.

BizTech magazine has put together an infographic that highlights six core questions every company should consider before moving forward with BYOD:

  1. Who buys the devices?
  2. What’s the right policy?
  3. What’s the employee’s role?
  4. What’s the impact on IT?
  5. How do we tackle security?
  6. How about apps?

For each of these questions, we’ve outlined a good answer, which we’d advise you to follow; a bad answer, which probably isn’t the best way to handle things; and an ugly answer, which should be avoided at all costs. Hopefully, this will help your company remain on the pleasant side of this growing workplace trend.

The organization in this design is really well done.  After explaining the concept of BYOD, the infographic walks the reader through six questions and provides some stats and information about each aspect.  The text is short, the illustrations are relevant and entertaining and the information is valuable to companies.

One of the data visualizations is hard for the readers to understand.  Highlighting 72% of employers as six people icons is very odd (Use 10 icons for percentages), but then they correctly used 10 icons when visualization 70% of Cisco employees.  At the bottom of the infographic image, it’s missing a URL to the original infographic landing lage, and a copyright statement.

Thanks to Ricky for sending in the link!

Monday
Aug132012

Cellular Jerks: Where are your Mobile Manners?

Cellular Jerks infographic

So how in tune are you with your technology? Do you take calls on the toilet? Do you sleep with your phone on your bed? See what percent of the U.S. you fall into with the Cellular Jerks infographic from onlinecollege.org.

If you’re considering the pursuit on an online education, chances are you’re pretty plugged into the Internet and technology world.  Modern students everywhere are increasingly engaged with their tech devices, and with the rapid rise of mobile Internet access, many are even able to gain access to the materials and resources they need to study on the go.

 But this easy access might very well be both a blessing and a curse: The rise of mobile access has given rise to savvy, plugged-in individuals, but it may very well also have given rise to another being entirely, namely, the cellphone jerk.  Everyone seems to know someone or interact with a person who just doesn’t seem to have any mobile manners.  From loud conversations at inappropriate times to rude texting at an awkward moment, it seems like more and more people are getting lost in their own cell phone interactions. So attached are people to their cell phones that sometimes, those little devices end up in some interesting places.

 Don’t feel like you’re that addicted?  Check out the following infographic and see for yourself: You might be surprised to realize that you could be a cellular jerk, too.

I like this one because of the fun use of illustration to make the statistics more personal and can relate them to our everyday lives.

Many of the statistics are just shown in text instead of visualized, and most designers don’t understand that by not visualizing those values, it makes them visually “less important” to the readers.  This is especially true the further down the infographic you get, which also implies the project was rushed or the designer got lazy deeper into the design.

The clear Creative Commons license in the infographic is fantastic.  The URL directly to the original infographic landing page should have also been included.

Found on Online College.org 

Tuesday
Jun262012

Ruby on Rails Popularity Index 2012

Ruby on Rails Popularity Index 2012

Ruby on Rails isn’t about the gem, but to some people it is just as valuable. It allows people to enter the basic programming world as painless as possible. The Ruby on Rails Popularity Index 2012 infographic created by exist.com (found on infographicjournal.com) illustrating its popularity!

Ruby on Rails has taken the web development world by storm since its first full release in 2005. Yet with new web platforms arriving each day, usage share of frameworks has become quite fragmented. So in this post, I compiled the latest trends and figures of Ruby on Rails from different sources, as well as some stats of the Ruby language.

Here’s an infographic we’ve created that visualizes how far Ruby on Rails has gotten since its release in 2005.

This design from Exist.com comes from Philippines, so there are a couple English grammars errors like “oftenly”, which isn’t a real word.  The design does a good job gathering a number of stats from different sources together to show the general trend of growing usage of Ruby on Rails over the last 5 years or so.

Tuesday
Jun262012

Client: Avoid the Dip from IPO Lockups

Wealthfront Lockup Avoid the Dip infographic

Avoid the Dip: The Effect of Lockup on Stock Price is a new infographic InfoNewt designed for Wealthfront.

A flood tide of shares is hitting the market in May and June, as a number of the high-profile tech IPOs from the fall emerge from lockup periods, including Jive Software (JIVE), Zynga (ZNGA) and Angie’s List (ANGI).

If you’re one of the employees of the 28 companies whose lockups are expiring in May or June, you’re wondering how to diversify your portfolio and when to sell.

Here’s our research on the question of what to do in the days immediately following the lockup expiration, presented visually to help you see the dip that typically follows the end of the lockup.*

As valuable financial information to many employees of the tech companies going IPO this year, Wealthfront looked back at 254 prior technology company IPOs to chart “The Dip” that consistently have a price dip the first day after the Lockup ends.

Don’t understand what a Lockup is?  That’s explained in the infographic as well.

Thanks to the team at Wealthfront!