About
Randy Krum
President of InfoNewt.
Data Visualization and Infographic Design

Infographic Design

Infographics Design | Presentations
Consulting | Data Visualizations

DFW DataViz Meetup

Join the DFW Data Visualization and Infographics Meetup Group if you're in the Dallas/Fort Worth area!

Search the Cool Infographics site

Custom Search

Subscriptions:


Feedburner

The Cool Infographics® Gallery:

How to add the
Cool Infographics button to your:

Cool Infographics iOS icon

- iPhone
- iPad
- iPod Touch


Read on Flipboard for iPad and iPhone

Featured in the Tech & Science category

Flipboard icon

Twitter Feed
From the Bookstore

Caffeine Poster

The Caffeine Poster infographic

Entries in explanation (22)

Tuesday
Jul092013

What Is Autism?

What Is Autism? from Global Medical Education is a long, informational infographic that covers the symptons, signs, types, treatments and history of diagnosing autism.

Autism Spectrum Disorder is very common. About 1 in 50 school aged children had parent reported ASD in 2011-2012. There have been changes in DSM-5 with the category of Autism Spectrum Disorder being introduced  which includes Autistic disorder, Asperger’s disorder, Rett’s disorder and Pervasive Developmental Disorder-NOS from DSM-IV. Researchers have studied several important questions in this disorder.

This is a big design with a bunch of good information.  However, I think it’s way too much text for an infographic.  Infographics should make information easier to understand, and most readers won’t stick around to read this much information.  In fact, many readers won’t read any of the information because that much text is intimidating and implies an investment of time and attention by the reader.

The information is fantastic, and should have been broken up into multiple infographics to cover the different topics.  This would make the information easier to digest, and would also spread out links and views to the hosting site over a longer period of time.

Thanks to David for sending in the link!


Monday
Jul082013

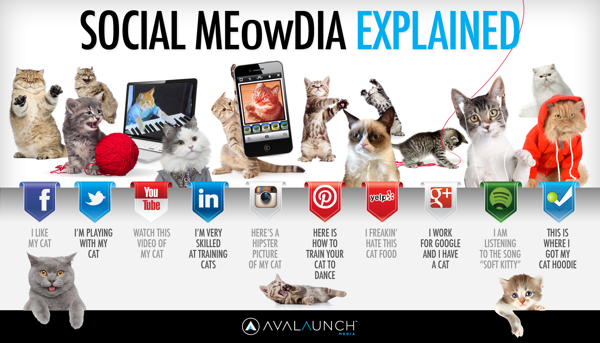
Paws vs. Claws: Social Media Explained

Social Media Explained Cat infographic


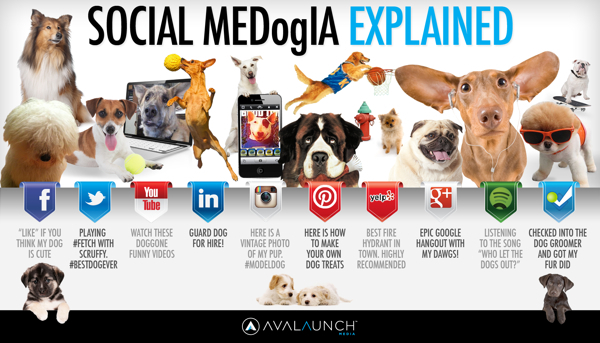
Avalaunch Media is running the Paws vs. Claws infographic voting competition between these two infographic that explain the social media networks from the perspective of dogs and cats.  The campaign is raising money for charity, so place your vote now (before July 31st) and donate money if you are in a position to support the causes.

A Social Media Bark-off of Epic Purrportions!

Here’s how it works:

We’ve joined forces with two world-renowned, animal-focused, non-profit organizations — The Humane Society of The United States is being sponsored by the Claws (a.k.a cats) and NEADS/Dogs for Deaf and Disabled Americans is being sponsored by the Paws (a.k.a. dogs).

We’re inviting internet-and-animal-loving companies and individuals everywhere to join us in donating to a pot of charity-cash. We’re kicking off the sharing by pledging $500 to the to-be-determined winner of the Paws vs Claws showdown and we’re counting on you, our internet-and-animal loving friends, to join in donating to the charitable cause.

Social Media Explained Dog infographic


 Thanks to Matt for sending in the link!


Monday
Jul082013

How Startup Funding Works

How Startup Funding Works infographic

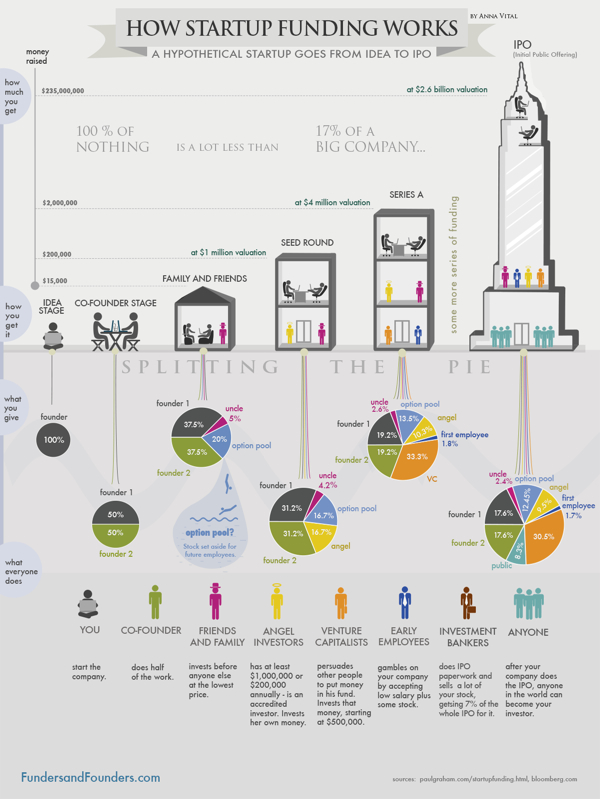
How Startup Funding Works from Funders and Founders co-founder Anna Vital does a great job of visualizing the split of equity at different stages of a company’s life.

A hypothetical startup will get about $15,000 from family and friends, about $200,000 from an angel investor three months later, and about $2 Million from a VC another six months later. If all goes well. See how funding works in this infographic:

Is dilution bad? No, because your pie is getting bigger with each investment. But, yes, dilution is bad, because you are losing control of your company. So what should you do? Take investment only when it is necessary. Only take money from people you respect. (There are other ways, like buying shares back from employees or the public, but that is further down the road.)

This is a great design that uses pie charts correctly and effectively!  This is in contrast to the many designs that use pie charts inappropriately.  This is a great example of a visual explanation that uses a combination of data visualization, illustration and text to tell a clear story.

The color coding is also effective, but for some reason they didn’t color the co-founder icon character green to match his portion of the pies.  The URL link to the original infographic landing page is also missing in the footer, so it makes it hard for readers to find the full-size original version when they see it posted on other sites.  People aren’t always good about creating links back to the original, so the URL should be included in the infographic image file itself.

Tuesday
Jun042013

Home Energy Savings

Home Energy Savings infographic

70% of electricity in the US is generated from non-renewable sources.  The Home Energy Savings infographic provided by Accent Building Products tells us how to have an energy efficient home without sacrificing comfort.

Today it is more important than ever to make our homes more energy efficient without sacrificing home comfort. An energy-efficient home will keep your family comfortable while saving you money. Unfortunately, a lot of energy is wasted through leaky windows or ducts, old appliances, or inefficient heating and cooling systems. You can use many tips to save money and energy! This infographic details many different money saving tips and shows how we spend the money on our homes.

Infographic provided by Accent Building Productsa direct distributor of the industry’s top accent home and building products.  All products are shipped to you directly from the manufacturers’ factory.

It’s interesting from an online marketing and SEO perspective that I can find the infographic on gallery sites like Infographics Showcase, Infographics Inspiration, and Visual.ly but I was unable to find the original anywhere on the Accent Building Products website or blog.  This means that any popularity in terms of links and visitors to the infographic itself will benefit the gallery sites, but not Accent Building Products.  Only indirectly will Accent get any benefit if readers separately visit their site, but they would have to manually type in the URL because none of the infographics have a link back to the site.

This is a fun visual explanation design.  The illustrations clearly put the suggestions and data into context of the areas in the house.  There is a lot of text, but the small callouts make it easy to read.  It would have been more effective to visualize the pieces of data that are included in the design.

Thanks to Chris for sending in the link!

Tuesday
Jun042013

The Makings of a Modern Home

The Makings of a Modern Home infographic

Keeping up with technology is always a full time job. Now even your home can have technology upgrades. The Makings of a Modern Home infographic from In Style Modern helps keep all of us current with information on updating your home with the newest technology.

There isn’t a text description on the landing page, or even in the infographic itself.  The reader is left to determine if these are real, current technologies or a forecast of what’s coming.  Personally I think it walks the line between the two.  The Nest Thermostat is very real, but self driving cars aren’t available to the public yet.

This design would have been better in landscape orientation, where the information could have connected more easily with the locations shown in the isometric house illustration.  I understand why they chose to use the Tall Format though, to make the display on the blog and in services like Pinterest easier.

Thanks to Therese for sending in the link!

Friday
May312013

UK Income Tax and National Insurance

Income Tax and National Insurance - What are you really paying? is a new infographic video explanation from the team at See What You Mean that helps unravel the complexity of the UK tax system.

The UK’s taxes on people’s wages are needlessly complex and obscure. Produced with the team from See what you mean, the video highlights how National Insurance is a second income tax in all but name.

Previous YouGov polling for the TPA has shown that many people are not aware of how much tax they actually pay. The video makes clear the real rates of tax people pay when Employee’s National Insurance and Employer’s National Insurance are factored in.

Thanks to Richard for sending in the link!

Tuesday
May212013

DNA Explained

BBC Knowledge Explainer DNA from Territory on Vimeo.


An animated visual explanation of DNA found on creativeblog.com.

BBC Knowledge and Learning is exploring a wide variety of topics from social history to science in a series of three-minute online Explainer documentaries, and commissioned Territory Studio (territorystudio.com) to produce an animated film on the subject of DNA.

Three minutes is a short time to explore a subject where most doctorates only scratch the surface, so writer Andrew S. Walsh teamed up with molecular biologist Dr Matthew Adams to distil the script down to the most fundamental elements required to understand not only DNA’s form and function but how our understanding of these discoveries has affected the wider world. While this length may feel restrictive, the team found that this limitation acted as a lens, focusing the piece on the essentials.

The Explainer series is designed to intrigue and inform, encouraging those who discover the documentaries to further explore through links to additional information found on the BBC website.

Thanks to Jordan from sayitvisually.com for sending in the link!

Thursday
May022013

Connecting The Dots

Connecting The Dots infographic Habitat for Humanity

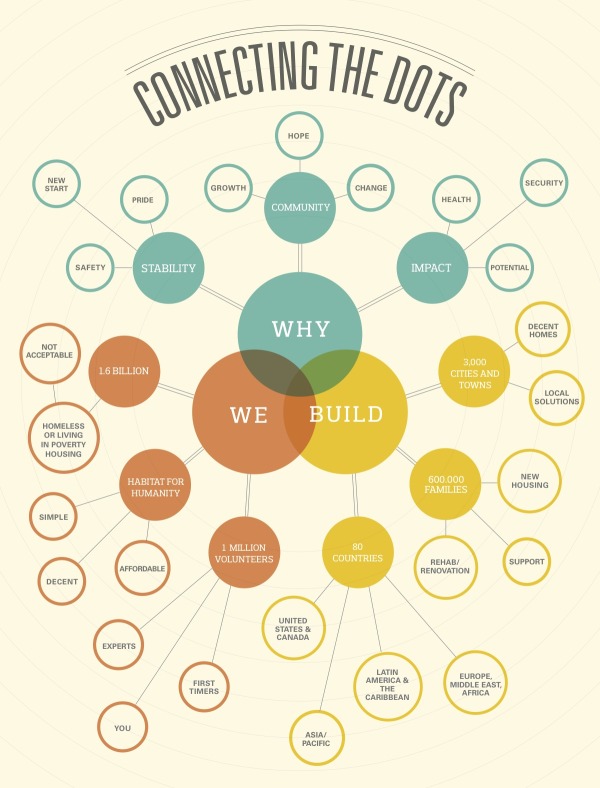
Connecting the Dots is a mind map design from Habitat for Humanity.  It was published in the May 2013 edition of their own magazine, Habitat World, and made available online as a PDF download.

Learn more about how Habitat builds homes, communities and hope.

I really like the combination of the Venn diagram in the center and the mind map nodes that extend outward.  The sizes of the circles doesn’t have any meaning, just sized to fit the text.  This is a really good way for Habitat for Humanity to tell their story with a visual explanation.


Friday
Nov162012

Choosing the Right Line - The Science of Corners

Choosing the Right Line- The Science of Corners infographic

Choosing the Right Line- The Science of Corners infographic is a design about Motocross.  Motocrossgear.com takes the science of successfully navigating corners in motocross racing and brings it to the infographic world. 

Since the beginning of racing, riders have been faced with many choices on the track. The fastest rider is often the one who chooses the best lines on the track. Many factors exist when deciding which line to take through a corner. Use this visual guide to help you pick the fastest line.

Not a design based on a lot of data, this visual explanation relies more on diagrams to communicate the message.  In general, I really like the design style that reinforces the feel of motorcross, but in my opinion this could be a better design with less text.

Thanks to John for sending in the link!

Wednesday
Nov142012

Total Solar Eclipse 2012

Total Solar Eclipse 2012 infographic

Today (Nov 14th) will be a total eclipse of the Sun, and the Solar Eclipses infographic from turu does a great job with visually explaining eclipses and sharing the statistics from prior eclipses.

The total solar eclipse of 2012 is set to be a spectacular event. Occurring just after sunrise on November 14 (local time), the eclipse will be best viewed from Cairns in Australia. Already a popular tourist destination, the 2012 eclipse is expected to flood the coastal city with thousands of domestic and international visitors.

The infographic provides a definition of a solar eclipse as well as information on the Australia 2012 eclipse. It offers an insight into past solar eclipses, noting duration of totality and effects on local tourism.

With a number of events scheduled such as the Solar Eclipse Marathon and the Eclipse 2012 Festival, Cairns aims to cater to this expected influx of tourists. Renowned for its sunshine, Cairns is expected to be a prime location to view the 2012 eclipse. The next opportunity to view a total eclipse in Australia will be in the year 2028, making this year’s event truly special.

A good design that tells a good story.  In the footer should be a Copyright statement, and the URL to the infographic landing page so readers can find the origial full-size version.