Designing Infographics That Last
The web is inundated with new content on an hourly basis. So much so that it can be hard for any content to stand out. Readers have an attention span shorter than a goldfish! With trending hashtags, sponsored posts and the brevity of posting with fewer than 140 characters, hot trending topics often play a factor in the success of your infographics. But it doesn’t have to.
While we’re busy flitting from one project to the next, always looking ahead, it’s possible to lose track of our content once it has passed the design phase. But the long-term success of your content relies on more than just good design. I define the Online Lifespan of your infographic as the amount of time it remains relevant to the audience, and it plays a huge role in the measurable success of your content.
First, you need to determine your project’s goals. What is your goal for this infographic? Are you looking for a short-term boost in traffic? Or are you looking to post content that readers will view and share for years to come?
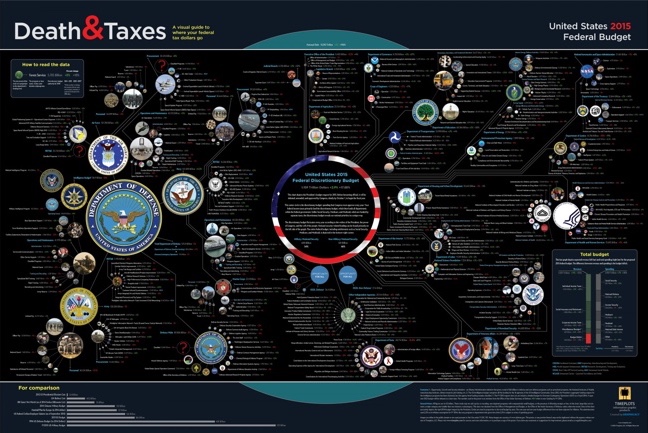
Sometimes your infographic works with an online lifespan somewhere in between. For example, the annual “Death & Taxes” poster visualizes the Federal Budget and has a lifespan of a year before its information becomes outdated when a new budget is released.
SOURCE: Timeplots
If you’re looking for longevity, however, choosing a lasting topic for your content can work to your advantage. Here are just a few of the benefits:
- More bang for your buck: It essentially costs you the same amount of time and resources to design an infographic with a short online lifespan as it would for a design with a long lifespan. You spend the same amount of time and effort in your design and research, but gain two very different results.
- Visibility: No one will be searching for the Top 10 Christmas Traditions in 2015 after December 25, 2015, so all of your traffic needs to happen within a short period of time. A longer-lasting way to frame this infographic would be to create a timeline of Christmas traditions over the last few hundred years. Although this isn’t typically “evergreen” content, you’ll see a resurgence of traffic every year around Christmas time. Without a hard end-date, your infographics can live on driving views, backlinks and social shares for years to come.
SOURCE: Balsam Hill
-
Less maintenance: Once you’ve created a piece of evergreen content, there’s little to no maintenance necessary to keep your content relevant.
While there are situations where trendy and timely content can work in your favor, creating content with a longer online lifespan can lead to longer lasting success. It all comes down to the topic choice and the type of data.
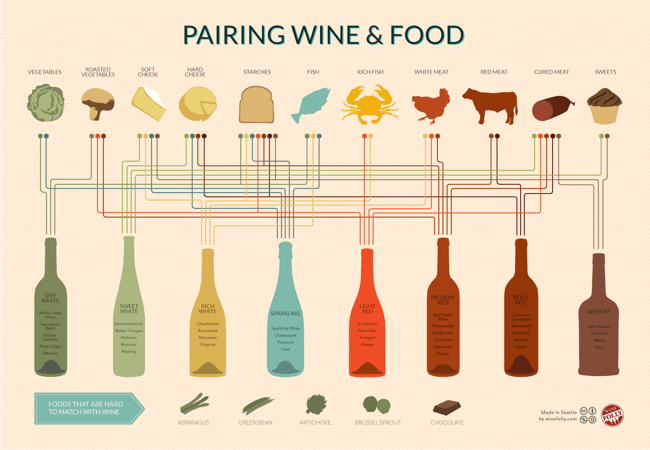
Selecting your topic is the most important factor in determining the online lifespan of your infographic. Jumping on a breaking news topic is a great way to get your client some quick visibility, but does little to increase its long-term exposure. However, coming up with truly evergreen content like the infographic below will keep your content relevant long after you’ve created it.
SOURCE: Wine Folly
Keep these goals in mind when selecting a topic for your next infographic. A blend of trending topics and evergreen content can build a very robust content strategy.
 Randy
Randy
This post also appeared on The Huffington Post
 Online Lifespan,
  SEO,
SEO,  content,
  design,
  infographics,
  publicity,
  topics


