


Using Visuals to Enhance Your Credibility
Infographics and visuals have become the lifeblood of storytellers, be it marketers, professors, presenters, etc. They are constantly battling short attention spans, information overload, and little vested interest from their audience. The smart marketer knows their target, and comes with a battle plan to defend against all of these things. This is where visuals come in.
Reasons to Use Visuals
We’ve relied on visuals for everything from street signs and movie banners to websites and presentations. Using visuals to express information has long been a part of our history. Here are just a few more reasons to use them in your presentations and marketing efforts:
1. Getting Attention
A visual makes information stand out more than just text alone. Studies estimate that between 50-80% of the human brain is dedicated to forms of visual processing.
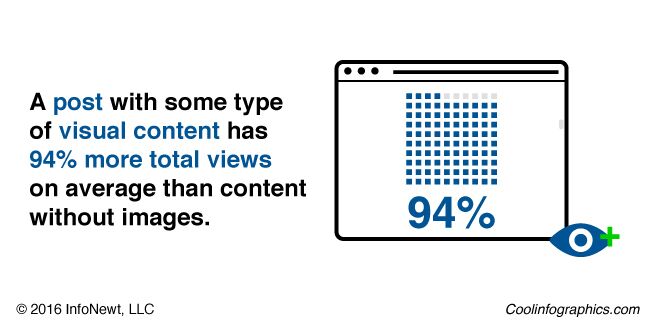
On social media, they simply take up more real estate than their text only counterparts. A post with some type of visual content has 94% more total views on average than content without images, according to MDG advertising.
2. Simplicity
As humans, we’re simply wired to receive rich visual information, and can understand more complex information when it is presented visually. Infographics are a great way to provide your audience with context when displaying statistics that are otherwise meaningless.
3. Credibility
Credibility is one of the biggest reasons to use visuals. Put a statistic in an article and it is questioned. Put a statistic in a visual and it is fact.
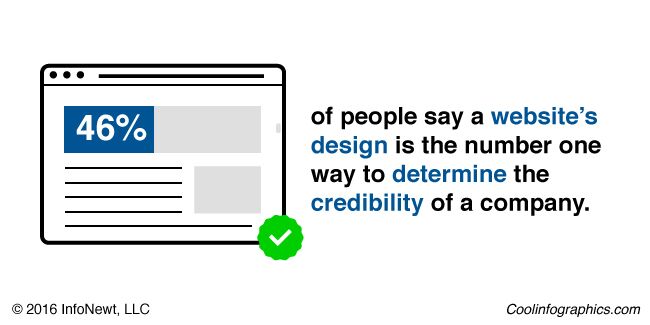
In fact, every form of visual information lends credibility to what is presented. 46.1% of people say a website’s design is the number one way to determine the credibility of a company, according to the Stanford Persuasive Technology Lab.
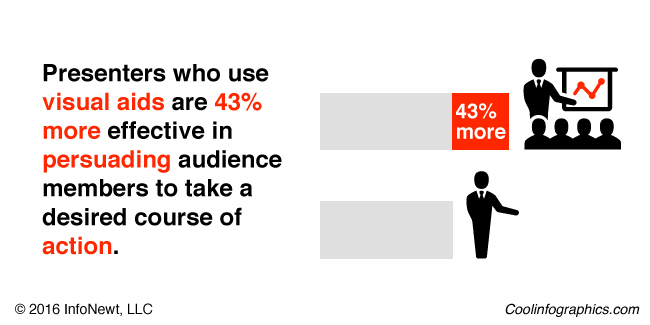
This works the same way in presentations. In 1986, a 3M-sponsored study at the University of Minnesota School of Management found that presenters who use visual aids are 43% more effective in persuading audience members to take a desired course of action.
Use This Power Responsibly
In light of this information, it is important to use this responsibly. Providing accurate information is the most important thing content marketers and visual storytellers will do. No matter how beautifully crafted your infographic or visual is, it can be destroyed by one misrepresented fact, or out-of-context statistic.
 Randy
Randy
This post also appeared on The Huffington Post

Reader Comments (2)