About
Randy Krum
President of InfoNewt.
Data Visualization and Infographic Design

Infographic Design

Infographics Design | Presentations
Consulting | Data Visualizations

DFW DataViz Meetup

Join the DFW Data Visualization and Infographics Meetup Group if you're in the Dallas/Fort Worth area!

Search the Cool Infographics site

Custom Search

Subscriptions:


Feedburner

The Cool Infographics® Gallery:

How to add the
Cool Infographics button to your:

Cool Infographics iOS icon

- iPhone
- iPad
- iPod Touch


Read on Flipboard for iPad and iPhone

Featured in the Tech & Science category

Flipboard icon

Twitter Feed
From the Bookstore

Caffeine Poster

The Caffeine Poster infographic

Entries in Google (32)

Friday
Aug272010

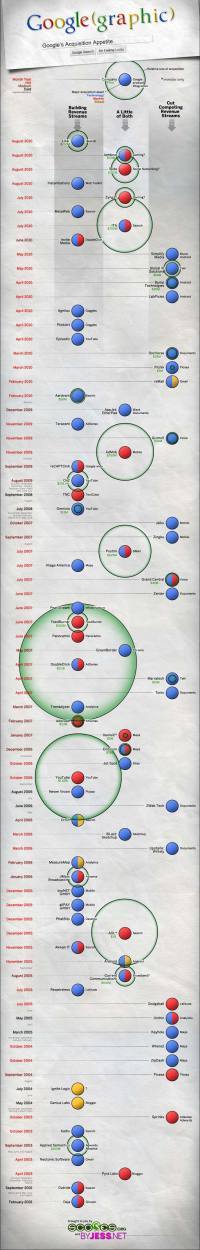
Google(graphic) - Google's Acquisition Appetite

From Scores.org, a data-heavy Google(graphic) by Jess Bachman, Google’s Acquisition Appetite.  Visualizing almost 10 years of Google’s acquisitions and investments, and there’s hardly a month that Google didn’t invest in something.

I like the multiple dimensions to the data.  Three columns show how the acquisition helped Google, the colors of each acquisition show what assets were gained, an additional circle shows the value of the acquisition (if it is known) and of course the timeline aspect.

Great job Jess!  I’d love to see you keep this updated somewhere.


Monday
Aug232010

Google Maps for Mobile timeline

Last week, Vic Gundotra, Vice President of Engineering ay Google, posted the Google Maps for Mobile timeline on the Google Mobile Blog as part of his post on the history of Google Maps for Mobile Devices.

Page 1 ... 1 2 3 4