


Entries in presidential (46)
 Randy
Randy

Americans Remain Woefully Ill-Informed

Wired magazine calls infographics like this "infoporn". I guess you could call this a version of a bubble chart, but it shows a comparison of what people knew in 1989 vs. 2007. Separately it shows knowledge of three questions based on the respondent's usual source of news.
I can't tell how big the sample size was, or what type of people they interviewed. It quotes the source as the Pew Research Center for the People & the Press, but that alone isn't enough to make it credible.
Katrina's Blame Game

Following the Katrina Diaspora graphic, here's another one related to Hurricane Katrina that maps the blame from different key figures and celebrities. I found this on mylifestream.net and originally from nytimes.com in October 2005.
2008 Presidential Campaign Finances

This interactive infographic from the New York Times website is really impressive. Using weekly data reported by the Federal Election Commission, it plots the contributions on a map of the U.S. and sizes the bubbles based on contributions from that city. It has data from every week since January 1st, so it will also "play" and animated version showing the contribution as time progresses (similar to the Trendalyzer that Google purchased from GapMinder).
You can also search for specific contributors to see which candidate campaigns they have contributed to, and how much they gave.
Death and Taxes 2008
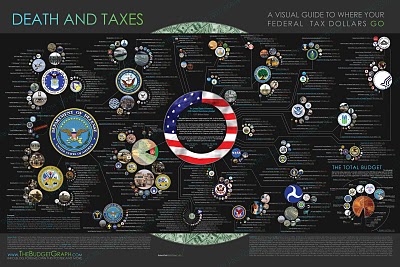 NEW Death and Taxes infographic for 2008!
So this is what the President is asking for, not the final budget. Compare this to the final 2007 discretionary budget from my earlier post.
It is the 2008 Federal discretionary budget of the United States. is a representational poster of the federal discretionary budget; the amount of money that is spent at the discretion of your elected representatives in Congress. Basically, your federal income taxes. The data is from the President's budget request for 2008. It will be debated, amended, and approved by Congress by October 1st to begin the fiscal year.
An interactive Flash version is online at www.thebudgetgraph.com/poster.
Top Presidential Contributions 1Q

It's early for the 2008 election, but major campaign funding has already started. It will be interesting to see if more money early in the race makes a difference in the outcome.
From washingtonpost.com