About
Randy Krum
President of InfoNewt.
Data Visualization and Infographic Design

Infographic Design

Infographics Design | Presentations
Consulting | Data Visualizations

DFW DataViz Meetup

Join the DFW Data Visualization and Infographics Meetup Group if you're in the Dallas/Fort Worth area!

Search the Cool Infographics site

Custom Search

Subscriptions:


Feedburner

The Cool Infographics® Gallery:

How to add the
Cool Infographics button to your:

Cool Infographics iOS icon

- iPhone
- iPad
- iPod Touch


Read on Flipboard for iPad and iPhone

Featured in the Tech & Science category

Flipboard icon

Twitter Feed
From the Bookstore

Caffeine Poster

The Caffeine Poster infographic

Entries in SEO (19)

Friday
Nov292013

Seven Myths of Email Marketing

Seven Myths of Email Marketing infographic

The Seven Myths of Email Marketing infographic from Alchemy Worx addresses many of the misconceptions about email marketing head on.

Many beliefs that email marketers hold true regarding email are simply false, according to research and analysis conducted by my email marketing agency, Alchemy Worx. We analyzed data sourced from our work with customers and industry figures to arrive at our conclusions.

Here are seven such email myths, which are also presented in an infographic at the end of this article.

Great information with fun illustrations that attract viewers.  The statistics should be visualized though, instead of just shown in text.  Big fonts are not data visualizations, and don’t make the data any easier to understand for the readers.

Footer has good information with full links to the sources, a clear copyright and the company logo.  It’s only missing the URL link back to the infographic landing page so readers can find the orignal when people post it without a link back to the Alchemy Worx site.

Thanks to Christine for sending in the link!


Wednesday
Nov132013

How to Setup Google Authorship in 6 Minutes

How to Setup Google Authorship in 6 Minutes infographic

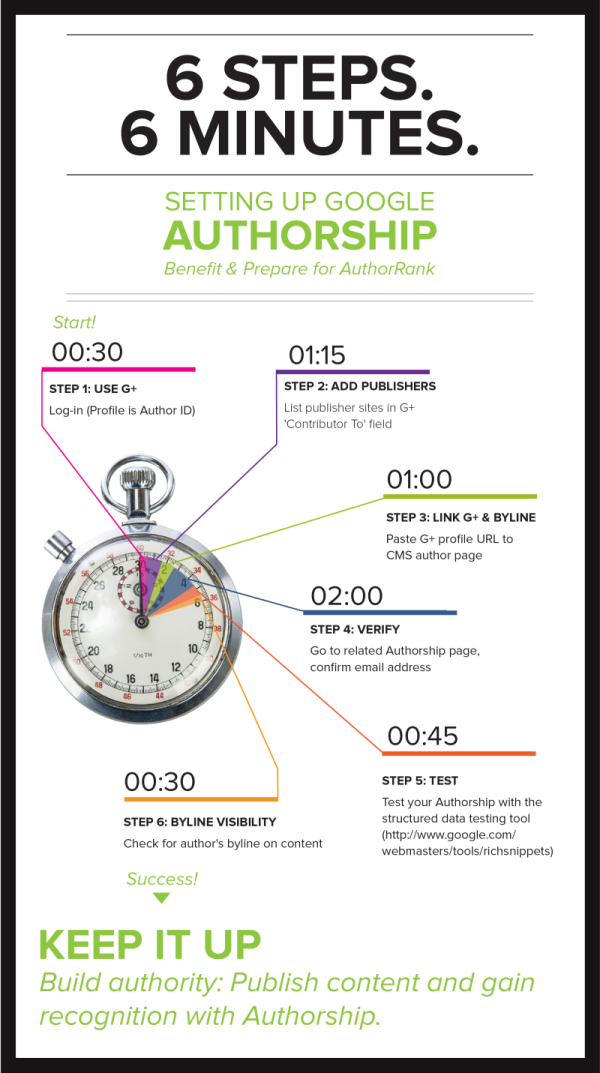
How to Setup Google Authorship in 6 Minutes is simple, clear, focused design from Brafton.

Google Authorship helps brand publishers personalize the custom content they post to their websites. Studies show that including an author’s byline and headshot in search engine results pages (SERPs) increases clicks and may eventually improve PageRank. 

Brafton’s “Content marketing, meet Authorship” resource outlines everything a savvy marketer must know to benefit from Google technology, and our accompanying infographic makes it even easier to setup Authorship on a given site. (Our downloadable resource includes a print-friendly version of this graphic!) Follow these six steps (in about six minutes) to be on your way to publishing online content using Google Authorship. Don’t forget to read our related blog: Why It’s Time to Embrace Authorship, and download our free resource.

This infographic design keeps it simple for readers by telling one short story really well.

Knowing that the PNG image file of the infographic will be shared on other sites, the design should have included the Brafton logo, a copyright statement, and the URL for readers to follow to find the original, full-size version of the infographic.  Not all bloggers are good about linking back to the original landing page.

Monday
Mar042013

2012 SEO Tactics

2012 SEO Tactics infographic

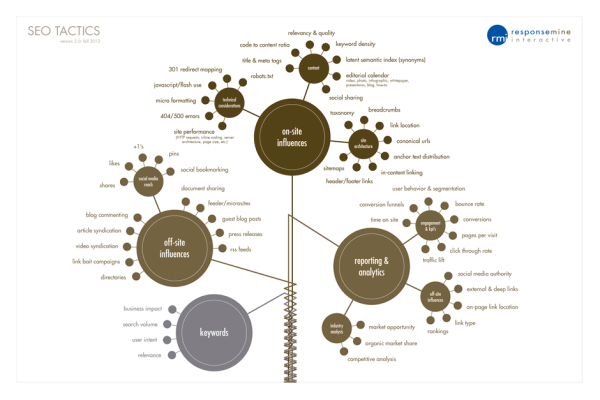
The 2012 SEO Tactics infographic from Response Mine Interactive breaks down the tactics they use to get the highest rankings for their clients in 2012, and expect them to stay the same for the majority of 2013. The four main tactics are on-site influences, off-site influences, reporting & analytics, and keywords.  

These are the components of a dominating SEO campaign. It’s a simple infographic listing and weighting every tactic we employ to gain top rankings for our clients and make them millions of dollars. Expect this chart to stay current through most of 2013.

A Little History

Since 2001, RMI has managed direct response digital marketing campaigns for world class companies like Rooms to Go, The Home Depot, Staples, Travelzoo and Hallmark. 

But does it come in a poster?!

Yes! If you would like a FREE 36x24 color poster simply email your name and address to deborah.fisher@responsemine.com and we will send it to you. 

Free Downloads

The poster and large format graphic was such a huge hit last year we’ve decided to take it a step further, Desktop Wallpaper. Simply choose the size that fits your monitor resolution. It should open in another tab/window then just right-click and save the file locally. Enjoy: 1024x7681280x8001280x10241366x7681440x9001680x10501920x10801920x12002560x1440.

Found on http://visualoop.tumblr.com

Monday
Jan142013

SEO & Infographics - an Interview with Eric Enge

Eric Enge, Author and SEO GuruRecently, I had an amazing opportunity to interview Eric Enge about SEO & Infographics.  Eric has incredible insight in the world of SEO as a consultant, author, speaker and entrepreneur.

Eric Enge is the CEO of Stone Temple Consulting, a consulting company that provides a full range of Internet marketing optimization services including: strategic business planning, on page search engine optimization, link building, content optimization, conversion optimization, social media optimization, user engagement, and pay-per-click campaign development and optimization. Eric is co-author of the book The Art of SEO, a speaker at numerous search marketing events, and a contributing author to Search Engine LandSearch Engine Watch, and SEOmoz

 The interview covers some of the hottest topics that impact the infographics design industry today:

  • Infographics as part of a content marketing strategy
  • How Google’s changes to their algorithm impacts infographics
  • Infographics relevance and accuracy
  • Using attribution links, anchor text and embed code for infographics
  • Infographics on Pinterest 

You can read the complete interview on the InfoNewt blog

Wednesday
Sep262012

How Much Does SEO Cost?

How Much Does SEO Cost? infographic

How Much Does SEO Cost? is generally a mystery in the online marketing world.  The range is certainly big, from under $50/month up to the unbelievable price of over $250,000/month!  This informative infographic shares the results of custom research from SEOmoz, and was designed by AYTM.

How much does SEO cost? How much time do you have to discuss the various models and prices out there! However, a new survey sheds some light on the subject.

Over 500 people and companies who offer search engine optimization services were asked about how their models. Turns out, it’s most common to charge $100 to $150 per hour, in the US. But by-the-hour consulting is only one of four nearly co-equal ways of charging.

Also popular is project-based pricing, where the average price is between $2,500 to $5,000, in the US. That’s also the same average price for those who buy on a monthly retainer basis. Fixed prices on a contract basis is also a popular way that SEO is sold, but no averages were provided.

The survey was conducted by SEOmoz and compiled into the infographic below by AYTM:

From a design standpoint, there are a lot of things I like about this infographic.  

The consistent columns for regions of the world make the layout very easy to follow.  The data is also organized nicely by starting with basic demographic data to provide a foundation to the reader before getting into “The Main Event” - the main research results.

The data visualizations are fairly simple, and very easy for the reader to understand.  I also like the variety of data visualization methods; no one wants to see all bar charts.  The color scheme is also simple, which visually implies a certain level of authority.  By taking complex data and designing simple visualizations, the design shows the readers that SEOmoz has a clear understanding of the content.

The actual values are not included in the design, which is disappointing.  Since this was custom primary research, I have no way to validate the data visualizations without seeing the data, and that reduces the credibility of the entire design.  From a sharing perspective, it’s hard to quote interesting statistics in a text Tweet or Facebook post without having the numbers to work with.

Legends are Evil!  My biggest complaint is their use of legends in a few sections.  In those charts, the colors are visually hard to differentiate, and the reader has to work very hard to understand which pie slice or bar goes with each color.  This is only a problem in the Agency Type and Common Client Types sections.  The rest do a good job of connecting the data labels directly to the visualization.

The footer should include some type of copyright statement, and the URL for readers to find the original infographic landing page.

Found on Visual Loop

Monday
Jul092012

Best Times to Tweet or Post on Facebook

Best Times to Tweet or Post on Facebook

You put a lot of thought, energy and sometime money into your long-format post or infographic, and you want to get the most traffic out of it you can, right?  Not only is it good SEO practice, but it feels good when someone “likes” your post on Facebook. So why not give yourself the best chance at receiving them? The Best Times to Tweet or Post on Facebook infographic from Raka has the inside scoop!

There are few resources better than URL shortener bitly for monitoring click-through rates for content shared on Facebook and Twitter. So when bitly released a report last month telling us all the best time to tweet or post to Facebook for click-throughs, we listened. And then we created an infographic.

This handy infographic highlights bitly’s data on the best times to share content on Twitter or Facebook if you’re looking to drive traffic to your site (or any site). Bitly found the best times to tweet for click-throughs are early afternoon Monday – Thursday, while Facebook content posted Wednesday at 3 p.m. generates the highest click-through rates, according to bitly’s data.

But why read words when you can look at pictures? Here’s the best-time-to-tweet-or-post-to-Facebook infographic created by digital agency Raka with data provided by bitly:

I really love designs like this.  The data visualization is big and center, and doesn’t need a lot of text to explain the key findings.  I would have reversed the color gradient so the the low times are mostly white and the highest times are dark red, but that’s just me.

At the bottom should be some type of copyright or Creative Commons statement, and the URL to the original infographic should also be included in the infographic design itself.

Hmmm…  Maybe I should have timed this post better…

Thanks to Brian for sending in the link!

Tuesday
Oct112011

Backyard Sports Court Dimensions

What a great use of an infographic!  From LandscapingNetwork.com comes The Guide to Backyard Sports Court Dimensions.

Get common court dimensions for basketball, horseshoes, shuffleboard, bocce ball, badminton, volleyball and tennis.

The topic is perfect to drive links and traffic to a landscaping site.  People are always looking up these dimensions, and by covering all seven of these in one infographic, this will attract views for years to come.  I was looking up the basketball free throw line dimension just last week!

Tuesday
May032011

Demand Media - Breaking the Bank

Demand Media - Breaking the Bank is a cool infographic published on OnlineMBA.com by designer Ricky Linn.

The content itself in interesting, and I remember reading the Wired article listed in the sources.  I like that the infographic combines the process flow of content creation, but also visualizes relevant statistics about how big and profitable Demand Media has become.  Overall it tells a good story.

Found on SiliconValleyWatcher.

Tuesday
Mar082011

The Infographic Noob Guide to Online Marketing

The Noob Guide to Online Marketing - Infographic

The Noob Guide to Online Marketing is a 6-month plan for non-marketers to use as a reference guide to succeed in online marketing.  Based on information and an article from Oli Gardner on SEOMOZ.org, the infographic was designed by Unbounce.com.

“Get me to page 1 of Google, while emailing our customers a bi-weekly newsletter, engaging influencers on Twitter, maintaining a captive Facebook audience, capturing new leads, and putting out 3 blog posts a week.” Harsh? Yes. Familiar? Definitely.

  • Part 1 is a cogged wheel showing 50 tasks broken down by discipline. If you print it out you can tear off each cog or mark the little check boxes as you complete each task.
  • Part 2 is a six month course to teach you how to become an internet marketer whether you’ve done it before or not. Compress the timeline if you’re a workaholic. It also contains a traffic timeline showing the effect certain actions will have on your inbound traffic growth.

 Found on Social Media Graphics and Visual Loop

Page 1 2