About
Randy Krum
President of InfoNewt.
Data Visualization and Infographic Design

Infographic Design

Infographics Design | Presentations
Consulting | Data Visualizations

DFW DataViz Meetup

Join the DFW Data Visualization and Infographics Meetup Group if you're in the Dallas/Fort Worth area!

Search the Cool Infographics site

Custom Search

Subscriptions:


Feedburner

The Cool Infographics® Gallery:

How to add the
Cool Infographics button to your:

Cool Infographics iOS icon

- iPhone
- iPad
- iPod Touch


Read on Flipboard for iPad and iPhone

Featured in the Tech & Science category

Flipboard icon

Twitter Feed
From the Bookstore

Caffeine Poster

The Caffeine Poster infographic

« Flight Patterns | Main | Who participates online? »
Thursday
Oct042007

Breathing Earth
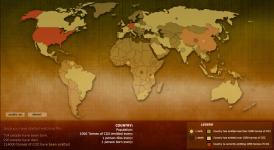

Breathing Earth is a cool website that displays international statistics in real-time, similar in concept to Poodwaddle.com's World Counter. Breathing Earth focuses on carbon dioxide emissions by country and adds population, births and deaths.

Welcome to Breathing Earth. This presentation displays the carbon dioxide emission levels of every country in the world, as well as their birth and death rates - all in real-time. Though considerable effort has been taken to ensure that the presentation uses the most accurate and up-to-date data available, please remember that this is just a simulation.
Breathing Earth was created by David Bleja (aka Stillwater), whose home website is stillwater-microcosm.net

Found on SimpleComplexity.net

PrintView Printer Friendly Version

EmailEmail Article to Friend

Reader Comments

There are no comments for this journal entry. To create a new comment, use the form below.
Editor Permission Required
While we are migrating to a new site design, you must have editing permission for this entry in order to post comments.