


Tuesday
Jul242007
Gapminder on Google!
 Randy
Randy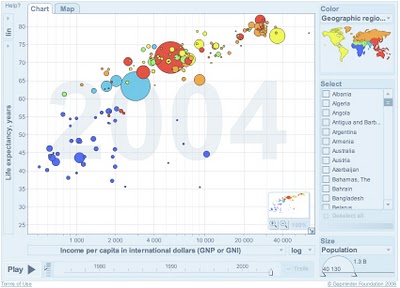
Here it is! Live on Google. Gapminder is the Trendalyzer software used by Hans Rosling and acquired by Google. It's now online at Google, but it looks like an early test. I'm not sure if you can use your own data yet or not, but that is one of the goals.
Check out all of the Gapminder tools, and see more presentations using the Gapminder software at www.gapminder.org

Reader Comments (1)
TC is a new concept in viewing statistics and trends in an animated way by displaying in one chart 5 axis (X, Y, Time, Bubble size & Bubble color) instead of just the traditional X and Y axis. It could be used in analysis, research, presentation etc. In different business sectors, to name a few we have Deutsche Bank Asset Management in NY, Vanguard, Institutional Investor, Perella Weinberg, RIM, Princeton University as our clients
The following link is for our new Geographical Trend Compass:
http://epicsyst.com/test/map/
Link on UK Master Card vs Visa performance :
http://www.epicsyst.com/test/v2/mastercard_vs_visa/
Links on Funds:
http://www.epicsyst.com/test/v2/best_exchange_traded_funds/
http://www.epicsyst.com/test/v2/us_insurance_funds/
http://www.epicsyst.com/test/v2/aaim_fund_performance/
Link on other KPIs :
http://www.epicsyst.com/test/v2/hospital_performance/
http://www.epicsyst.com/test/v2/international_insurance/
Link on Chile's Earthquake (27/02/2010):
http://www.epicsyst.com/test/v2/EarthQuakeinChile/
This a link on weather data :
http://www.epicsyst.com/test/v2/aims/
This is a bank link to compare Deposits, Withdrawals and numbers of Customers for different branches over time ( all in 1 Chart) :
http://www.epicsyst.com/test/v2/bank-trx/
Misc Examples :
http://www.epicsyst.com/test/v2/airline/
http://www.epicsyst.com/test/v2/airline2/
http://www.epicsyst.com/test/v2/stockmarket1/
http://www.epicsyst.com/test/v2/tax/
http://www.epicsyst.com/test/v2/football/
http://www.epicsyst.com/test/v2/swinefludaily/
http://www.epicsyst.com/test/v2/flu/
http://www.epicsyst.com/test/v2/babyboomers/
http://www.epicsyst.com/test/v2/advertising/
This is a project we did with Princeton University on US unemployment :
http://www.epicsyst.com/main3.swf
A 3 minutes video presentation of above by Professor Alan Krueger Bendheim Professor of Economics and Public Affairs at Princeton University and currently Chief Economist at the US Treasury using Trend Compass :
http://epicsyst.com/trendcompass/princeton.aspx?home=1
I hope you could evaluate it and give me your comments. So many ideas are there.
You can download a trial version. It has a feature to export EXE,PPS,HTML and AVI files. The most impressive is the AVI since you can record Audio/Video for the charts you create.
http://epicsyst.com/trendcompass/FreeVersion/TrendCompassv1.2_DotNet.zip
All the best.