


Wednesday
Sep052007
Marumushi News Map
 Randy
Randy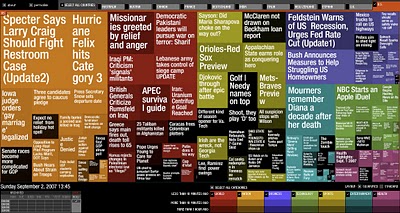
Marumushi.com has a fantastic News Map using the treemap visualization style. This is one of the best implementations of a treemap that I have found. Updated every 6 hours, it groups news stories (from the Google news aggregator) by overall category (technology, world, sports, etc.). You can choose to show the news map from 11 different countries, and the color shading of each block represents how old that particular news story is. Hovering your mouse over any square shows the whole title, and clicking takes you directly to the story.

Reader Comments (2)
Interesting application of a treemap, because at first, it didn't make sense. The web isn't space constrained - so why the treemap?
The relative size of the story block represents the number of related stories. However, this can be a bit misleading since it makes the assumption that the related stories are some surrogate for importance or relevance. (not necessarily a good assumption.)
An interesting excercise would be to build a treemap of hits for the same storie and then compare the two.
I would propose that your computer screen is space constrained, so the tree map is used to display all of the information within that constraint so you don't have to scroll to more data. The relative nature of the sizing works when you can see the whole tree map at once.
The block sizes based on the number of related stories can definitely be misleading. As you suggest, one based on the number of hits would be interesting, but I fear we would only see Brittany Spears stories. :)
Blocks based on the number of hits is also interesting philosophically. Just because a lot of people read the story, does that make the topic important? I could be convinced that yes, if the story is influencing a large number of people, no matter what the topic is, it is important to our society.