About
Randy Krum
President of InfoNewt.
Data Visualization and Infographic Design

Infographic Design

Infographics Design | Presentations
Consulting | Data Visualizations

DFW DataViz Meetup

Join the DFW Data Visualization and Infographics Meetup Group if you're in the Dallas/Fort Worth area!

Search the Cool Infographics site

Custom Search

Subscriptions:


Feedburner

The Cool Infographics® Gallery:

How to add the
Cool Infographics button to your:

Cool Infographics iOS icon

- iPhone
- iPad
- iPod Touch


Read on Flipboard for iPad and iPhone

Featured in the Tech & Science category

Flipboard icon

Twitter Feed
From the Bookstore

Caffeine Poster

The Caffeine Poster infographic

« Watercube, The Book | Main | The Age of Pop »
Tuesday
Oct072008

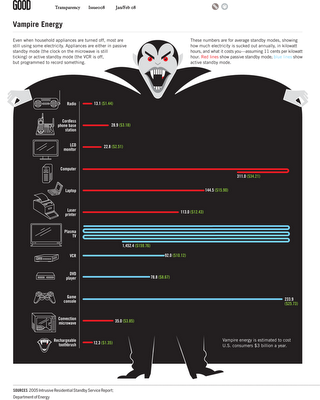
Vampire Energy infographic video & chart

From GOOD magazine, they created an infographic video about Vampire Energy, all of the energy used by electronics in your house while you are not actively using them.  The chart itself from the magazine is fairly simple chart, but I really like it.  It's effective getting the message across with simple graphics.

PrintView Printer Friendly Version

EmailEmail Article to Friend

Reader Comments (2)

I like Nigel Holmes work.

October 7, 2008 | Unregistered CommenterParka

Nigel really does some great work.

October 9, 2008 | Unregistered CommenterRandy Krum
Editor Permission Required
While we are migrating to a new site design, you must have editing permission for this entry in order to post comments.