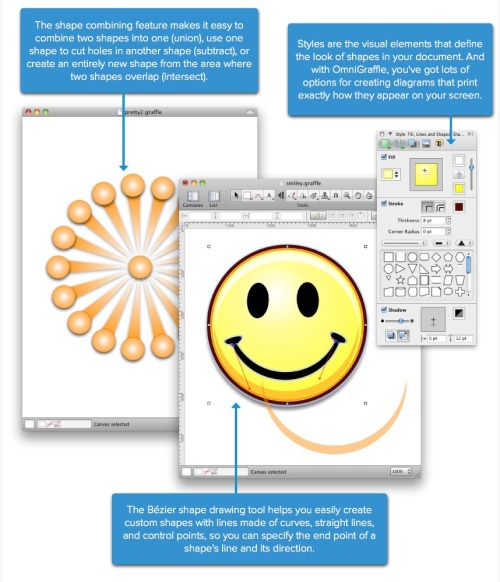
What Software do you use for Infographics?
A few readers have written emails to me asking about what software to use to create infographics. My needs are pretty simple for my day job, so I only have a handful of tools that I use loaded onto my MacBook. But the graphics I create are fairly simple, and don’t use massive amounts of data.
Yes, I included MS Office in the list because there are some really cool things you can do with Excel and PowerPoint. I’ll post some examples in the future.
What software do you use?
Post about your favorite software in the comments and share your “must have” software with everyone here.


 Randy
Randy

Reader Comments (24)
PowerPoint, Excel, Photoshop, Illustrator.
Illustrator, Photoshop, Cinema 4d, Flash and Poser, depending on the needs of each infographic...
illustrator. i used to use omnigraffle until i got tired of the bugs, crashes, weirdness, and overall sloppiness of the application.
How do you guys use Photoshop to create infographics? I hadn't considered that an infographic tool before.
Excel, Visio, Illustrator, MicroCharts, Xcelsius, Tableau, Wordle and ManyEyes to name the majority.
gliffy, google charts api
I don't use photoshop to create the infographic itself, but many times I have to manipulate the image I'm using for the graphic, making a sillouethe or just creating a new one. Whenever I create a 3d image, I use photoshop to make it more useful for the graphic. But no, I never use Photoshop as the main tool, it's just a little helper.
I use Illustrator, Flash, Matlab and a variety of Unix tools for data manipulation. Matlab is nice because you simply create a matrix of color values and pop it right up on the screen.
I use Illustrator and excel. They are very handy.
Freehand, Photoshop on my side. Love the wide space in Freehand.
Have you used eDraw - I find it pretty easy to use.
I've never actually designed an infographic myself, but at one point I was really interested in how they were made and I came across this link:
http://www.kdnuggets.com/software/visualization.html
Basically that page is just a giant compilation of infographic tools - Featuring a lot of obscure apps that haven't been mentioned yet
Also I realized googling "infographic software" is highly ineffective. For people that have been down that road try "data visualization software" instead
I use Creately (http://creately.com) for flowcharts and concept maps and bring in excel charts. works!