About
Randy Krum
President of InfoNewt.
Data Visualization and Infographic Design

Infographic Design

Infographics Design | Presentations
Consulting | Data Visualizations

DFW DataViz Meetup

Join the DFW Data Visualization and Infographics Meetup Group if you're in the Dallas/Fort Worth area!

Search the Cool Infographics site

Custom Search

Subscriptions:


Feedburner

The Cool Infographics® Gallery:

How to add the
Cool Infographics button to your:

Cool Infographics iOS icon

- iPhone
- iPad
- iPod Touch


Read on Flipboard for iPad and iPhone

Featured in the Tech & Science category

Flipboard icon

Twitter Feed
From the Bookstore

Caffeine Poster

The Caffeine Poster infographic

« The AlloSphere: Step inside your visual data! | Main | How do College Students Spend Money? »
Friday
Apr242009

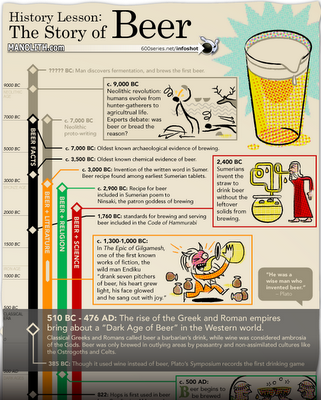
The History of Beer infographic


The History of Beer was published on Manolith.com.  I like the twist on a timeline infographic.  First, it's vertical instead of horizontal.  Then, it's actually four timelines in one highlighting different events in Science, Religion, Literature and Facts using the four colored tracks.

Design and layout by 600 Series Design, illustrations by Dan Zettwoch.

Check out some of the original sketches and story on Dan's blog.

PrintView Printer Friendly Version

EmailEmail Article to Friend

Reader Comments (1)

very fine blog

August 26, 2009 | Unregistered CommenterWOW GOLD
Editor Permission Required
While we are migrating to a new site design, you must have editing permission for this entry in order to post comments.