About
Randy Krum
President of InfoNewt.
Data Visualization and Infographic Design

Infographic Design

Infographics Design | Presentations
Consulting | Data Visualizations

DFW DataViz Meetup

Join the DFW Data Visualization and Infographics Meetup Group if you're in the Dallas/Fort Worth area!

Search the Cool Infographics site

Custom Search

Subscriptions:


Feedburner

The Cool Infographics® Gallery:

How to add the
Cool Infographics button to your:

Cool Infographics iOS icon

- iPhone
- iPad
- iPod Touch


Read on Flipboard for iPad and iPhone

Featured in the Tech & Science category

Flipboard icon

Twitter Feed
From the Bookstore

Caffeine Poster

The Caffeine Poster infographic

« Disney: Inside the Matterhorn Infographic | Main | Market Visual (BETA) knowledge maps »
Tuesday
Jun232009

The Story (so far) of Twitter


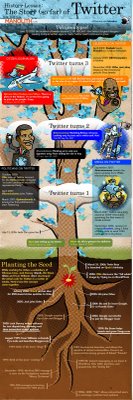
Graphic designed for Manolith.com, by infoshot.  It’s a reverse timeline of Twitter.

Twitter, Twitter, Twitter. Seems every where you turn these days that little blue bird is staring you right in the face. But how did it all start? Where is it all going? Who’s to say really, except you I suppose, in 140 character bursts. In the meantime let’s take a look back on some milestones of microblogging.  Please do enjoy, The Story (so far) of Twitter. Start at the bottom and work your way up on this one.


Of course, I found this on Twitter!

PrintView Printer Friendly Version

EmailEmail Article to Friend

Reader Comments (1)

very nice blog

August 26, 2009 | Unregistered CommenterWOW GOLD
Editor Permission Required
While we are migrating to a new site design, you must have editing permission for this entry in order to post comments.