About
Randy Krum
President of InfoNewt.
Data Visualization and Infographic Design

Infographic Design

Infographics Design | Presentations
Consulting | Data Visualizations

DFW DataViz Meetup

Join the DFW Data Visualization and Infographics Meetup Group if you're in the Dallas/Fort Worth area!

Search the Cool Infographics site

Custom Search

Subscriptions:


Feedburner

The Cool Infographics® Gallery:

How to add the
Cool Infographics button to your:

Cool Infographics iOS icon

- iPhone
- iPad
- iPod Touch


Read on Flipboard for iPad and iPhone

Featured in the Tech & Science category

Flipboard icon

Twitter Feed
From the Bookstore

Caffeine Poster

The Caffeine Poster infographic

« Tableau launches FREE Tableau Public today! | Main | The Crayola Color Timeline, 1935-2010 »
Tuesday
Feb092010

City Population Shift Maps

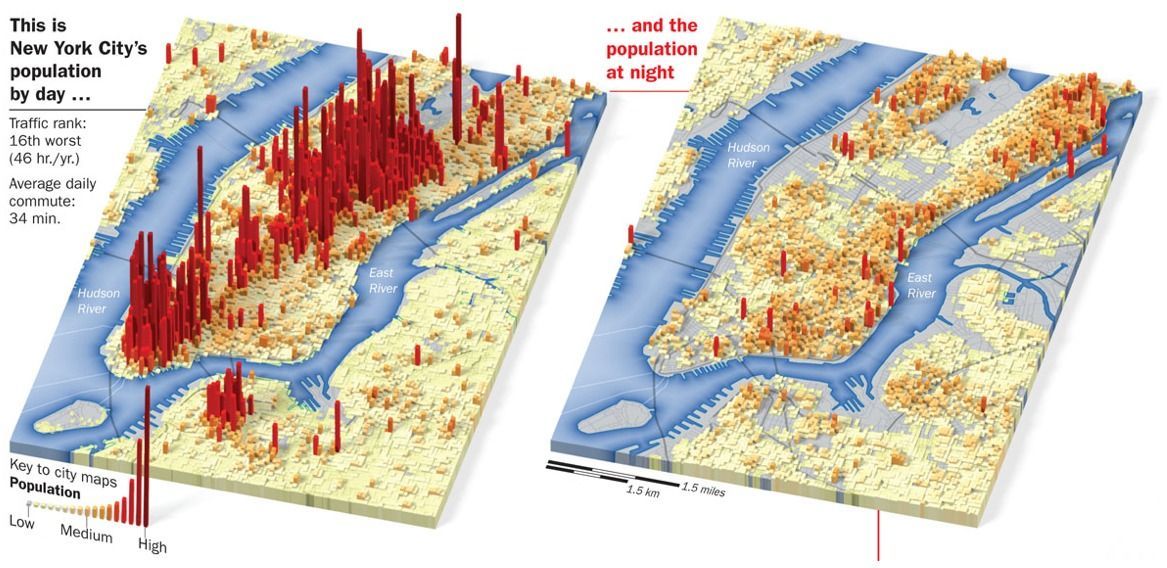
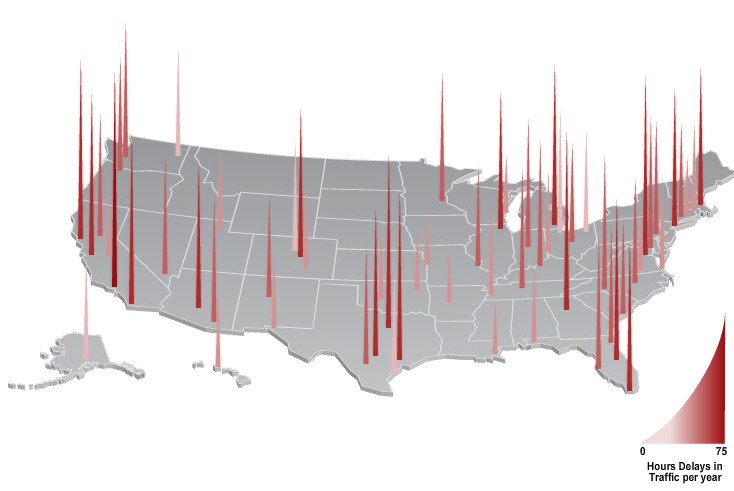
These Day-Night maps are from a Time Magazine November 2007 interactive map feature called One Day in America.  Other cities highlighted are Dallas, San Francisco, Seattle, Boston, Chicago and more.  The feature also included histogram map of traffic delays.  

The maps were created by Joe Lertola, who has some other great stuff posted on his website.

Thanks to justinpobrien for sending me the link in the comments.

PrintView Printer Friendly Version

EmailEmail Article to Friend

Reader Comments (1)

Francisco, Seattle, Boston, Chicago and more. The feature also included histogram map of traffic delays.
September 20, 2010 | Unregistered Commentersuodingwangzhi54
Editor Permission Required
While we are migrating to a new site design, you must have editing permission for this entry in order to post comments.