


The Sequel Map - Is Part II Ever Better than the Original?
 Randy
Randy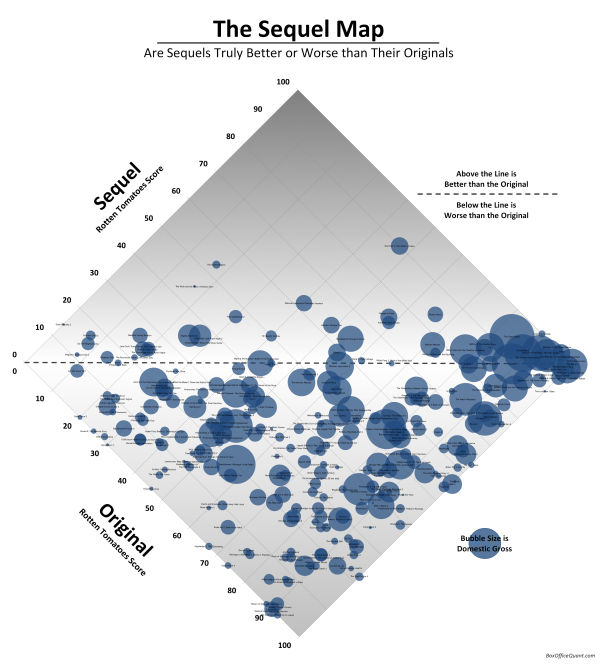
The Sequel Map, from BoxOfficeQuant.com is a cool chart of movie sequels showing how they compared to the original. The location is based on the RottenTomatoes.com scores of the original and the sequel being plotted. If the scores are the same, the movie would be exactly on the line, and any sequel with a score higher than the original is above the line. The sizes of the bubbles represent the total box office receipts.
As evidence, all sequels with Rotten Tomatoes scores have been categorized below, with the originals’ scores on the X-axis, and the sequels’ scores on the Y. Films at the center line are sequels with the exact rating as the original; films above are sequels that have surpassed the original; films below, ones that fared worse.
Notes: Categorization of sequels is sometimes more art than science, so I’ve had to follow a few rules: I’ve only included the second film in any series, never third or following films. I haven’t included remakes or “reboots,” and I’m only presenting films which opened (at some time) in the US and have Rotten Tomatoes ratings.
And finally, it’s worth noting that the only two film/sequel combos to both score 100%, are the first two Toy Storys and the French films Jean de Florette / Manon des Sources.
Rotten Tomatoes ratings from RottenTomatoes.com. US Gross from www.the-numbers.com
I especially like turning the chart 45°, which puts the best score possible for a sequel to improve on the original at the top center of the chart. If both the original and the sequel scored high, the bubbles are located towards the right instead of the top. I’ve done this with a number of 2x2 quadrant charts for clients.
So, according to the chart, Star Trek II: The Wrath of Khan was the best sequel improvement over the original, and I would have to agree.
I’d love to see a version that plots the box office receipts on the X and Y axes so that it would show the instances where the sequel made more money than the original. You could see more of the financial incentive behind making sequels, even if they’re generally rated lower than the original.
Found on VizWorld.com

Reader Comments (3)
Cool research though.
http://blog.2buildbacklinks.com/seo/info-graphic-map-of-factors-impacting-the-quality-of-a-backlink/