


The Illusion of Diversity: Visualizing the Soft Drink Industry
 Randy
Randy
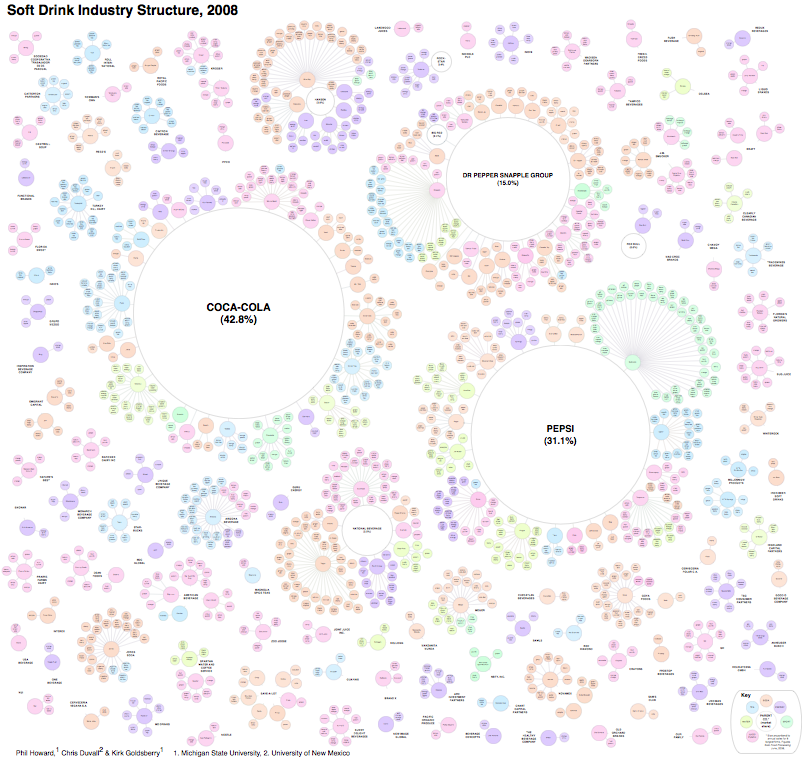
Very cool visualization from Philip H. Howard at Michigan State University called The Illusion of Diversity. It’s fairly big and hard to read, so I dropped the image link into Zoom.it to create the zoomable image above. You can see the high-resolution image here, or download the high-resolution PDF here.
Background
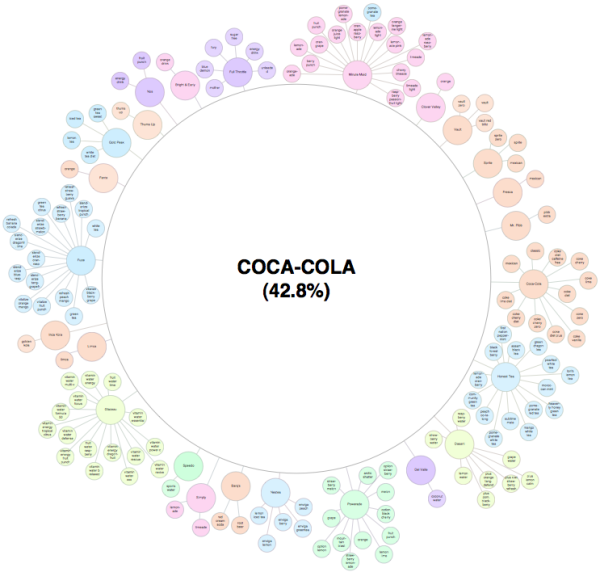
Three firms control 89% of US soft drink sales [1]. This dominance is obscured from us by the appearance of numerous choices on retailer shelves. Steve Hannaford refers to this as “pseudovariety,” or the illusion of diversity, concealing a lack of real choice [2]. To visualize the extent of pseudovariety in this industry we developed a cluster diagram to represent the number of soft drink brands and varieties found in the refrigerator cases of 94 Michigan retailers, along with their ownership and/or licensing connections.
Professor Howard’s team did a lot of legwork visiting stores to gather the data, recording 987 different varieties of soft drinks from 94 food retailers in the Lansing, Michigan area.
The statement “Three firms control 89% of US soft drink sales” really means that “89% of the drinks available come from only three firms”. The distinction is subtle, but there is no sales data included. This is just an ownership structure.
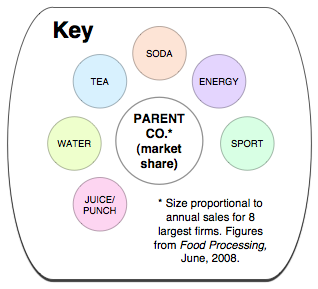
You also have pay attention to what you’re seeing. The bubble sizes are mixed because the parent company bubbles are sized to the portion of drinks they control, but the size of the individual drink bubbles is consistent and doesn’t convey any meaning. For the individual drink, the color-coding is what conveys meaning.
Conclusion
The illusion of diversity in the soft drink industry extends beyond obscuring ownership, as its products are primarily water and sweeteners. More research is needed on the links between pseudovariety and the consumption of energy-dense, nutrient-poor substances.
I noticed that this was created using OmniGraffle, which is a vector mapping application that I use a lot.
Found on Infosthetics.com and VizWolrd.com

Reader Comments (2)
Thanks for the cool info graphics :)