What is a Stock?
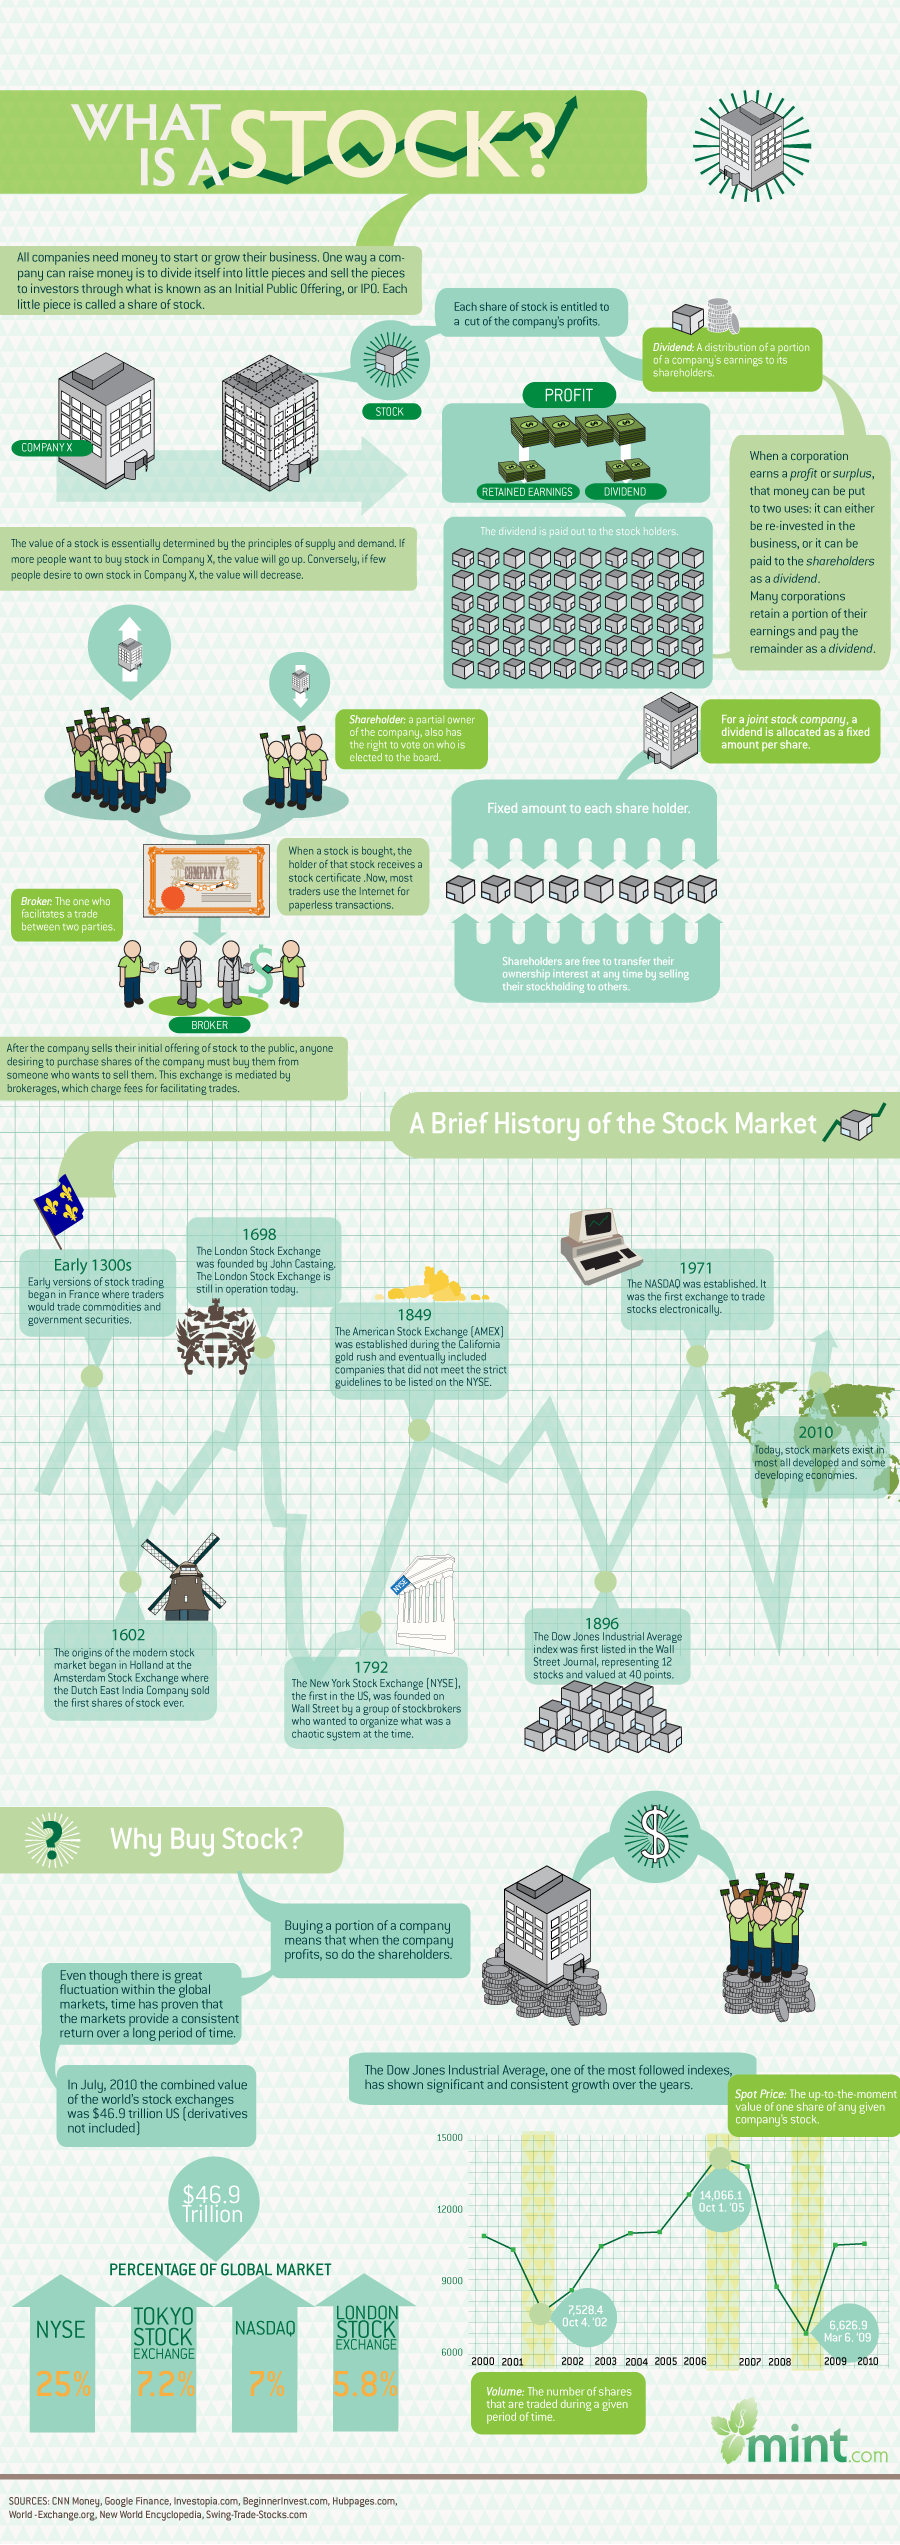
What is a Stock? from Mint.com explains what stock ownership is. It’s informative to the readers (a little text heavy), and doesn’t come across like an ad.
To make investment choices that ultimately pay off, you need to start by knowing the fundamentals. It’s a step many investor wannabes skip, since… well, studying the basic terms and trends is not exactly entertaining. We thought one way of helping you get a jumpstart on your basic investing terminology is a series of infographics that explain, visually, basic concepts. First up: what is a stock?
This is a good example of what I call the Online Lifespan of an infographic. Instead of an infographic about a recent news topic, this one covers an informational topic that doesn’t change or drop out of the news cycle. It’s more than a year old, but the information is still relevant, and continues to drive traffic for Mint. This design probably has an Online Lifespan for 4-5 years before the Dow Jones chart at the bottom makes the whole infographic feel dated.
What’s the line chart in the middle? It’s a timeline, but the height of the line chart has no meaning whatsoever. This should have shown some type of information, but instead is just confusing to the reader.
Thanks to Dawn for sending in the link!
 Online Lifespan,
  companies,
  corporations,
  money,
  spending,
  stock
stock 


Reader Comments (3)