The Visual History of the Political Parties (infographic posters)
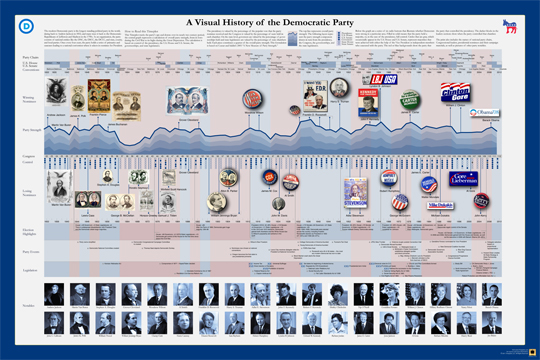
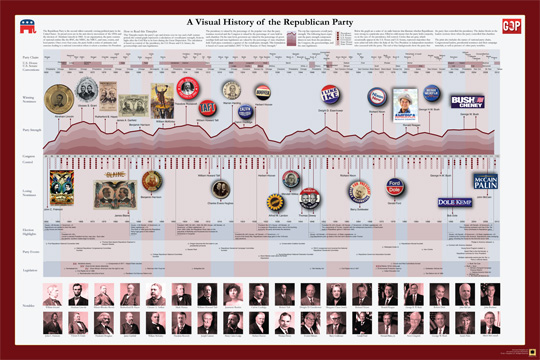
Timeplots.com has just released two new posters visualizing the history of the two major American political parties. Zoomable images of both A Visual History of the Democratic Party and A Visual History of the Republican Party are available so you can see all of the detail online.
Timeplots is also offering a discount to readers of Cool Infographics! Enter the Coupon Code “CIG020311” to receive 10% off until 3/31/11!
Just like the other great posters from Timeplots.com, these are highly-detailed posters, loaded with a huge amount of data. At its heart, they are timelines that show the overall party strength from 1832 (Democrats) or 1856 (Republicans) to the present. Along the timeline additional information is included like the names of the national party chairs, Congressional leaders, city where the party convention was held, who were the winning and losing party nominees for President (along with campaign material), election highlights, party events, major legislation, as well as pictures of other party notables.
You get the point that there is a lot of history in there!
It places each party event in historical context, visualizing a remarkable range of party events, legislation, election results, and leadership to succinctly tell the story of the party. Narratives are displayed within the larger context of party strength by aggregating and annotating data on presidential elections, Congress, Governorships and State Legislatures. The Timeplot provides a new lens into American political history; it is not intended to be absorbed at a glance, but rather to be visited and revisited over time.
Posters are 36” x 24” and normal price without the discount is $29.95.
Posters should start shipping by 2/28. Also, check the Timeplots.com site for student discounts on any of their posters.


 Randy
Randy


Reader Comments (1)