


The Radiation Dose Chart
 Randy
Randy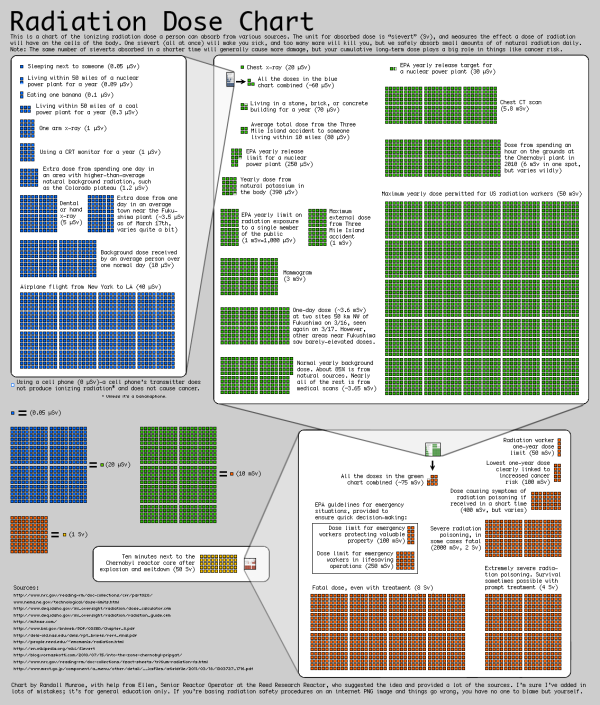
The Radiation Dose Chart from XKCD.com is very cool. Not part of the usual stream of comics, this is a more scientific chart from Randall Monroe helping to visualize the facts about radiation exposure.
There’s a lot of discussion of radiation from the Fukushima plants, along with comparisons to Three Mile Island and Chernobyl. Radiation levels are often described as “<X> times the normal level” or “<Y>% over the legal limit,” which can be pretty confusing.
Ellen, a friend of mine who’s a student at Reed and Senior Reactor Operator at the Reed Research Reactor, has been spending the last few days answering questions about radiation dosage virtually nonstop (I’ve actually seen her interrupt them with “brb, reactor”). She suggested a chart might help put different amounts of radiation into perspective, and so with her help, I put one together.
I’m not an expert in radiation and I’m sure I’ve got a lot of mistakes in here, but there’s so much wild misinformation out there that I figured a broad comparison of different types of dosages might be good anyway. I don’t include too much about the Fukushima reactor because the situation seems to be changing by the hour, but I hope the chart provides some helpful context.
Found on Bad Astronomy, Daring Fireball, FlowingData and VizWorld.

Reader Comments (2)