About
Randy Krum
President of InfoNewt.
Data Visualization and Infographic Design

Infographic Design

Infographics Design | Presentations
Consulting | Data Visualizations

DFW DataViz Meetup

Join the DFW Data Visualization and Infographics Meetup Group if you're in the Dallas/Fort Worth area!

Search the Cool Infographics site

Custom Search

Subscriptions:


Feedburner

The Cool Infographics® Gallery:

How to add the
Cool Infographics button to your:

Cool Infographics iOS icon

- iPhone
- iPad
- iPod Touch


Read on Flipboard for iPad and iPhone

Featured in the Tech & Science category

Flipboard icon

Twitter Feed
From the Bookstore

Caffeine Poster

The Caffeine Poster infographic

« Our Choice: Interactive, Infographic iPad book | Main | The Content Grid v2 »
Thursday
Jul142011

Distracted Driving Infographic

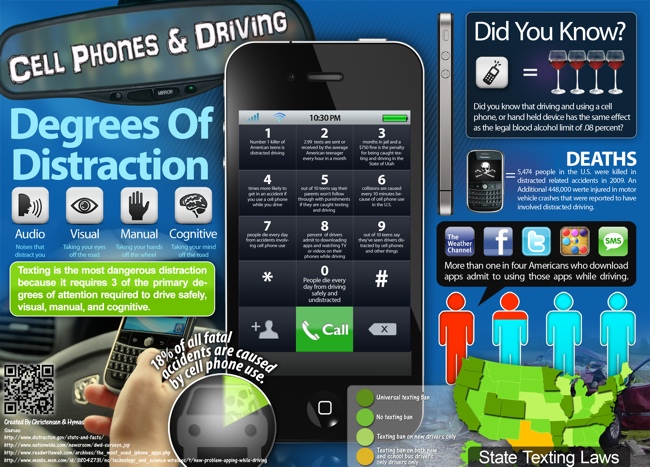
From the Christensen Law Firm in Utah comes the Cell Phones & Driving infographic that looks at the horrifying statisitics behind accidents and deaths caused by people using cell phones while driving in the U.S.

shocking facts about the realities of texting and driving in modern culture. It mentions, for example, that 18% of all fatal accidents are caused by cell phone use, and that 6 collisions occur every 10 minutes because of cell phones. In other words, keep the cell phone as far away from you as possible while driving, because frankly, becoming one these statistics is not an admirable achievement.

The design style is very crowded and busy, but I like the unique approach to using each number on the keypad as a statisitic.

“More than one in four Americans who download apps admit to using those apps while driving.”  On my iPhone, one of those apps is the TomTom GPS app, so of course I use it while driving!

Thanks to Jake for sending in the link!

PrintView Printer Friendly Version

EmailEmail Article to Friend

Reader Comments (3)

That TED video is amazing, I really hope they start doing that with college textbooks!
July 18, 2011 | Unregistered CommenterPeter
Time for a reality check guys !
July 26, 2011 | Unregistered CommenterGet Google+ Invite
Interesting design, and I do like the numbers being used as a statistic, but how can zero be true? Given the size of the world, the number of drivers in it, and the millions of other factors and chance occurrences; Not a single person has died while keeping their eyes on the road? Guess they never heard of a blowout.
September 2, 2011 | Unregistered CommenterFrank
Comments for this entry have been disabled. Additional comments may not be added to this entry at this time.