Sinking of the RMS Titanic vs. Costa Concordia
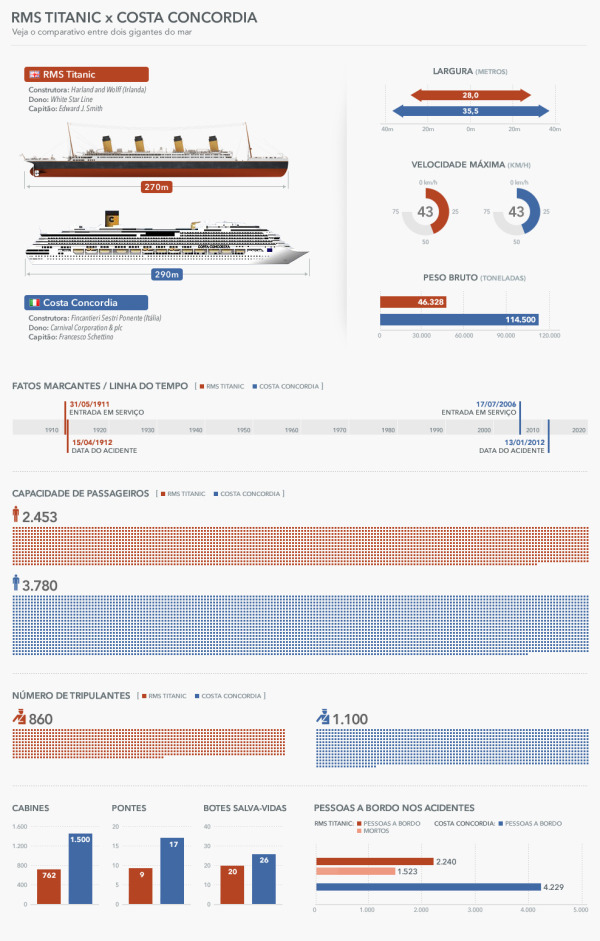
RMS Titanic vs. Costa Concordia (Veja comparação entre o naufrágio do Costa Concordia e do Titanic infographic) from Ultimo Segundo in Brazil compares the crash of the Costa Concordia (Blue) to the Titanic (Red).
Alguns dos sobreviventes do acidente do Costa Concordia compararam o naufrágio do navio italiano, que tombou após bater em uma rocha na costa da Ilha de Giglio em 13 de janeiro, com o do Titanic. “Concebido para ser inafundável”, segundo a operadora White Star Line, o RMS Titanic naufragou em 15 de abril de 1912 após ter-se chocado com um iceberg no Oceano Atlântico duas horas e quarenta minutos antes, na noite do dia 14.
ENGLISH Translation: Some of the survivors of the crash of the Costa Concordia compared the sinking of the Italian ship, which sank after hitting a rock on the coast of the island of Giglio on 13 January, with the Titanic. ”Designed to be unsinkable,” according to the operator White Star Line, RMS Titanic sank on April 15, 1912 after it collided with an iceberg in the Atlantic Ocean two hours and forty minutes before the night of the 14th.
What a great design! The best thing about this design is that it’s in Portuguese, but the visuals still make it understandable to anyone that doesn’t know the language! I understand the comparison between ship sizes, the dates of service on the timeline, the passenger capacities and the number of people aboard during the final accidents.
Thanks to Guilherme for sending in the link!


 Randy
Randy

Reader Comments (1)