The Genealogy of Automobile Companies
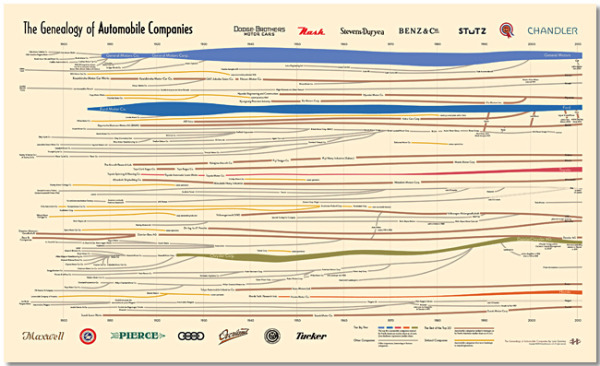
A brand new infographic poster designed by Larry Gormley at HistoryShots.com! The Genealogy of U.S. Automobile Companies visualizes over 100 years or corporate history of car company mergers, acquisitions and closures.
A flowing history of more than 100 automobile companies across the complete time span of the automobile industry. From 1900 to 1925 over 3,300 organizations were formed to produce automobiles in the United States. In 1910 alone 400 new startups entered the industry. Most attempts lasted less than two years. While car sales exploded (from 1910 to 2010 US sales rose from 200,000 to 11.5 million cars) the strongest entrepreneurs bought out rivals and combined forces. Today, ten companies account for about 90% of all US automobile sales.
This graphic uncovers and explains how the industry was created and how it arrived at its present form. At the core is a full genealogy of over 100 companies from the Big Five to the small defunct companies. Folded into the genealogy is the relative market share of US sales for each company.
The Big Five car companies have unique colors, and all of the other companies are color-coded into categories of he trest of the Top 20, defunct companies and other interesting or famous companies. The thickness of the lines change over time to represent market share.
You can buy a copy of the 38” x 23” poster for $29.95 over at HistoryShots.com
Thanks to Larry for sending in the link! Great design!


 Randy
Randy

Reader Comments (2)