NFL Concussion Watch 2013
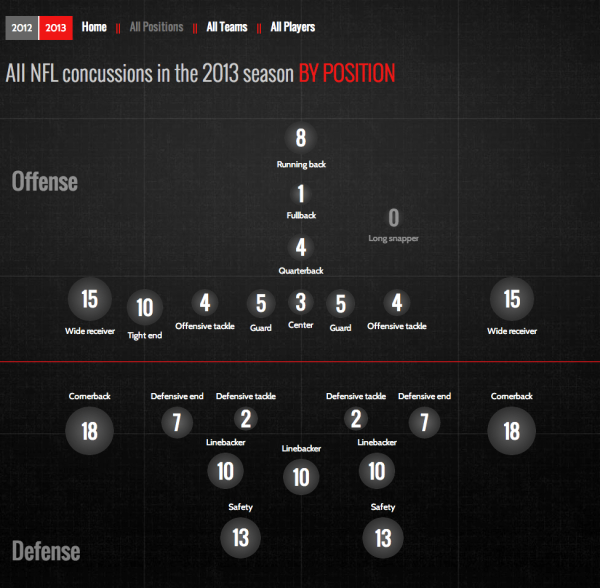
PBS Frontline has published the interactive data visualization, NFL Concussion Watch 2013 to summarize all of the player concussions reported in the NFL.
Every week in the National Football League, a player is sidelined by a head injury. In some cases, their symptoms are clearly visible and they exit the game. Other times, less obvious warning signs can mean a missed diagnosis and a return to the field. Either way, research indicates that the long-term health effects of such injuries — including memory loss, depression and even dementia — can pose problems for players long after retirement.
Concussion Watch is an effort to monitor the NFL’s response to the persistent risk of head injury in professional football. To do so, FRONTLINE will track which players are being removed from games after a hit to the head — and which players are not — and keep score of how long they are kept from the field following a concussion.
I really like the idea of this data visualization, but they messed up the visuals. The circle sizes are supposed to change relative to the values, but they’re not correct. The designer chose to make the circles for 1-3 too large in order to fit the numbers inside the circles, and 4-5 are larger but the same size. The choice of aesthetics over accuracy is a common mistake, and creates a false visual to the readers. It’s the wrong choice. Accuracy of the data visualization is more important than any other part of the design.
In visualizations, the design is supposed to visually compare values to create context and understand for the readers. Because some of these circles are larger than their actual values, this creates the impression that most of the football positions have similar risk, instead of clearly highlighting how less risky some positions truly are.
I do like the design layout that places the circles into their correct player positions. Readers can grasp this layout in a fraction of a second, and understand where the riskiest positions are.
Thanks to Melanie for sending in the link!
 Visualization,
  circles,
  health,
  interactive,
  sports


Reader Comments (1)