About
Randy Krum
President of InfoNewt.
Data Visualization and Infographic Design

Infographic Design

Infographics Design | Presentations
Consulting | Data Visualizations

DFW DataViz Meetup

Join the DFW Data Visualization and Infographics Meetup Group if you're in the Dallas/Fort Worth area!

Search the Cool Infographics site

Custom Search

Subscriptions:


Feedburner

The Cool Infographics® Gallery:

How to add the
Cool Infographics button to your:

Cool Infographics iOS icon

- iPhone
- iPad
- iPod Touch


Read on Flipboard for iPad and iPhone

Featured in the Tech & Science category

Flipboard icon

Twitter Feed
From the Bookstore

Caffeine Poster

The Caffeine Poster infographic

« NPR Chart Check from the Enhanced State of the Union (SOTU) | Main | I Love You in 130 Languages »
Friday
Feb152013

2013 NBA All-Stars Player Stats

2013 NBA All-Stars Player Stats infographic

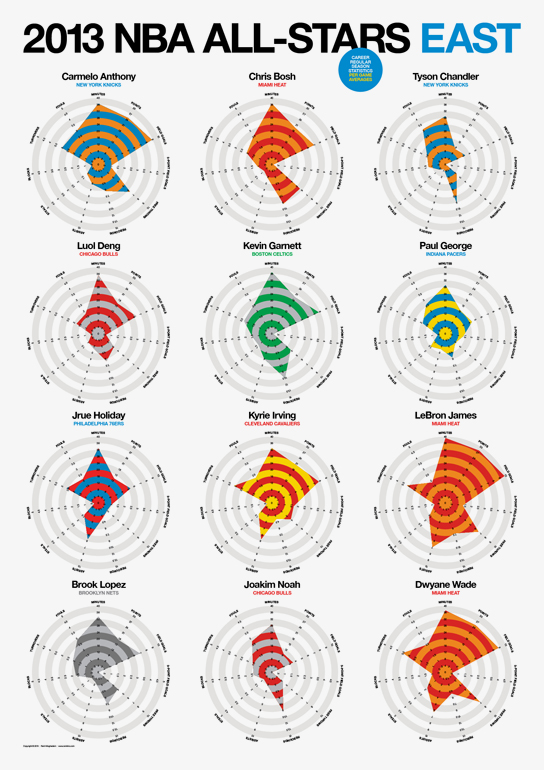
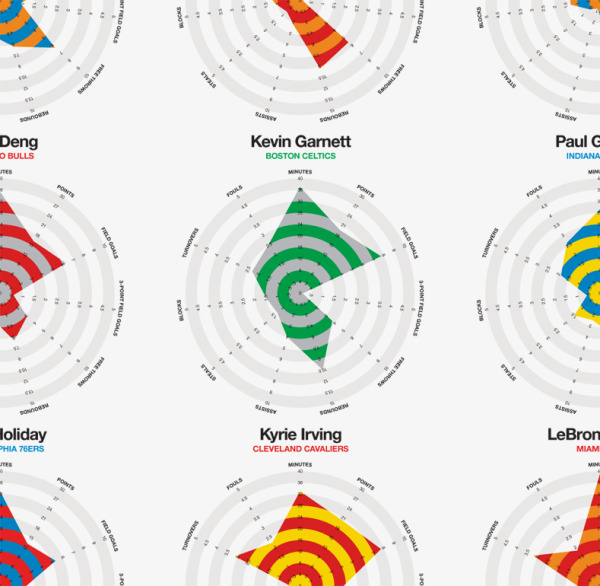
Rami Moghadam has just published two infographic posters detailing the stats for each of the players on the NBA All-Star teams.  2013 NBA All-Stars East and 2013 NBA All-Stars West both use radar charts to highlight each player’s strongest areas.

2013 NBA All-Stars Player Stats infographic

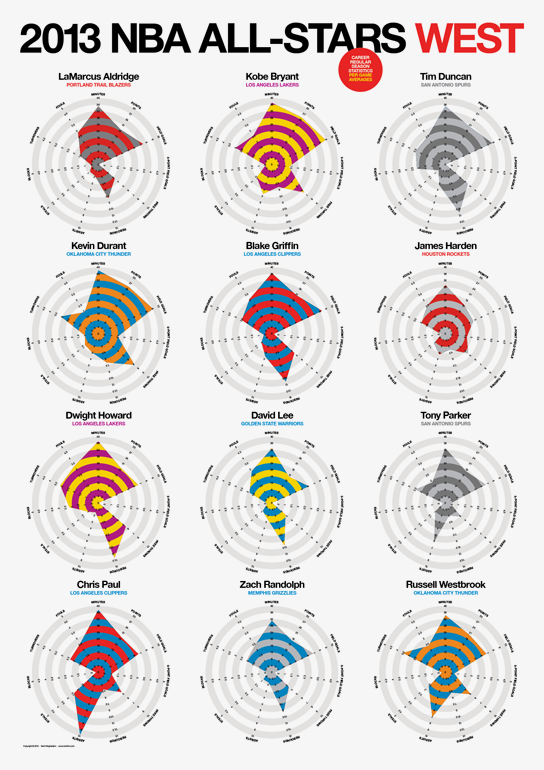
The individual radar charts are color-coded for each player’s regular team.  In the radar charts, you have to look at each stat to determine which direction is a favorable number.  A high number of turnovers isn’t a good thing, so I might suggest reversing the direction of some of the negative stats like fouls and turnovers.

2013 NBA All-Stars Player Stats closeup infographic

Good job Rami, and thanks for sending in the link!

PrintView Printer Friendly Version

EmailEmail Article to Friend

Reader Comments (3)

The individual radar charts are color-coded for each player’s regular team. how wonderful!
February 16, 2013 | Unregistered Commenterluly
Rami, this is a fantastic job! The color coating on each radar chart really helps. The charts truly do an excellent job of highlighting each player’s strongest areas.
February 19, 2013 | Unregistered CommenterHollywood Hills Realtor
Randy, this is really cool. What software do you use to create these charts? Thanks.
August 16, 2018 | Unregistered CommenterGang
Editor Permission Required
While we are migrating to a new site design, you must have editing permission for this entry in order to post comments.