


JAWS
 Randy
Randy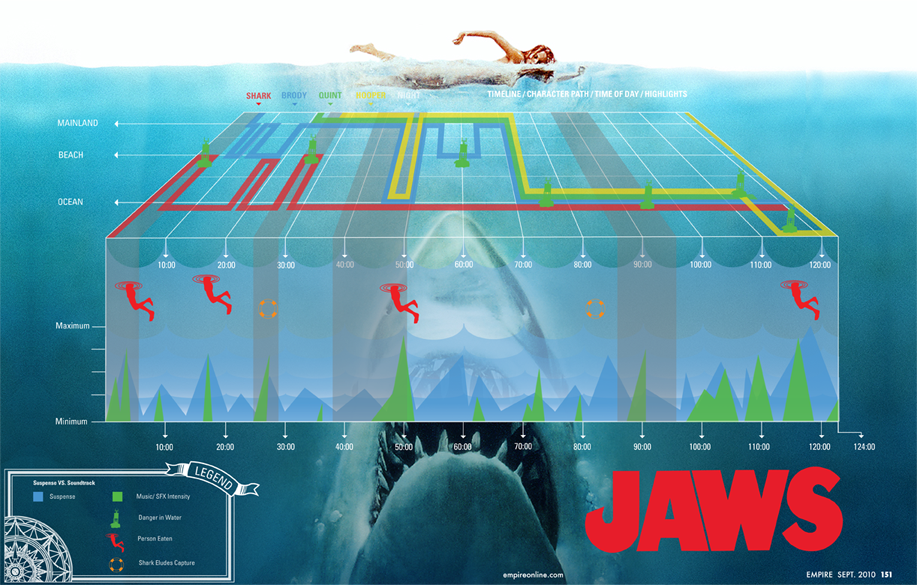
I’ve been meaning to post this one for a long time. JAWS, designed by Robert Machuga, uses the design style of the movie poster to create this cool infographic that visualizes multiple dimensions of data from the movie.
From Robert:
This project was an assignment in my senior year at the Hartford Art School where my class had to dissect a movie and translate it into an infographic Each of the colored lines represents the location of each of the main characters in the film divided into beach, mainland, and ocean. The red icons represent each time a human was eaten while the green buoy icons represent danger in the water. The orange lifesaver icons appear when the shark eludes capture and the timeline across the bottom spikes in green at points of musical intensity while the blue spikes are moments of suspense.
In approaching this project I really had to sit down with the film and the remote, fast forwarding and rewinding, trying to find the most pivotal events and themes that I could use to depict this movie in a static visual. I was trying to capture the thrill of the movie without loosing the story in the graph so I tried to break it down to it’s simplest forms. After many rounds, encouragement and great advice from professor John Nordyke I was left with the graph I have now.
Nice job Robert!


Reader Comments (1)