About
Randy Krum
President of InfoNewt.
Data Visualization and Infographic Design

Infographic Design

Infographics Design | Presentations
Consulting | Data Visualizations

DFW DataViz Meetup

Join the DFW Data Visualization and Infographics Meetup Group if you're in the Dallas/Fort Worth area!

Search the Cool Infographics site

Custom Search

Subscriptions:


Feedburner

The Cool Infographics® Gallery:

How to add the
Cool Infographics button to your:

Cool Infographics iOS icon

- iPhone
- iPad
- iPod Touch


Read on Flipboard for iPad and iPhone

Featured in the Tech & Science category

Flipboard icon

Twitter Feed
From the Bookstore

Caffeine Poster

The Caffeine Poster infographic

« This for That: A Guide to Cooking and Baking Substitutions | Main | Shelf Help Best Business Books »
Thursday
Aug142014

Coolness Graphed

Coolness Graphed


Coolness Graphed

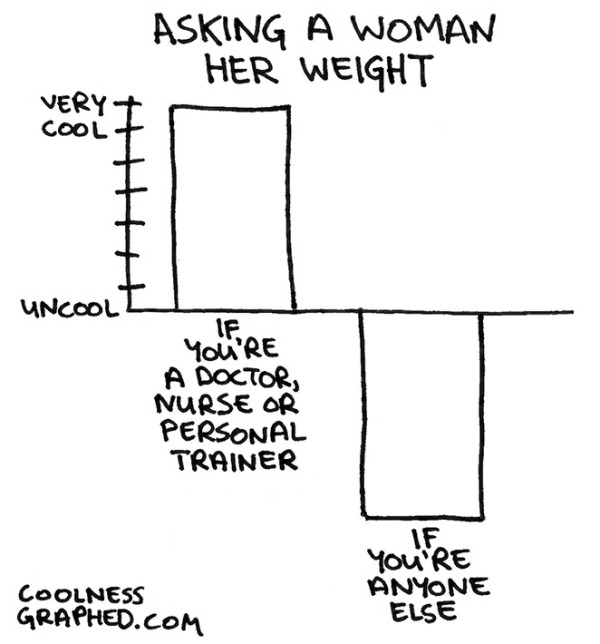
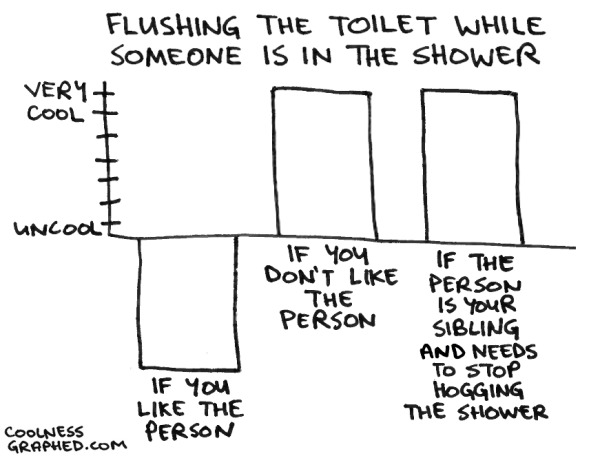
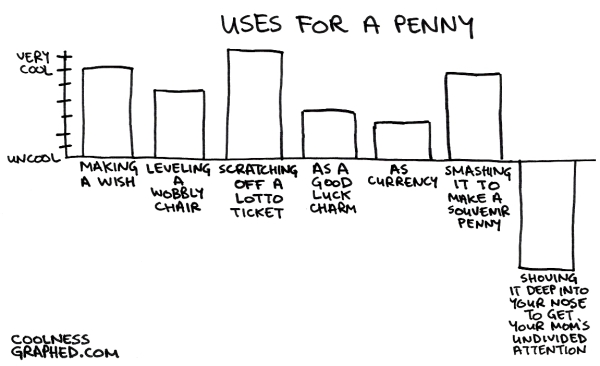
Coolness Graphed.com has a collection of bar graphs that describes when certain actions are deemed “cool” or “uncool”. The three shown here are just a few examples from the website.

Coolness Graphed.com brings normal events together with a humorous flare by rating them in a “cool”/”uncool” bar graph. The bar graph works well with the events as a visual ranking system. No real values are needed.  Data visualization used brilliantly!  It only takes seconds for the audience to understand each one, and they are highly sharable in social media.

The site has been running for more than two years now, and keeps getting funnier!  Thanks to Jones for sending in the link!

Now also available in a book!

PrintView Printer Friendly Version

EmailEmail Article to Friend

Reader Comments (1)

This is really great article.
July 7, 2015 | Unregistered CommenterGaurav
Editor Permission Required
While we are migrating to a new site design, you must have editing permission for this entry in order to post comments.