Histography
Histography is a timeline created by Matan Stauber that visualizes every moment in history from Wikipedia as a steel ball. You can navigate the timeline by using a slider to determine what time period you would like to see. Then simply place the courser over a ball to read an event! It is very easy to navigate and tons of fun. Go to Histography to visit the full imteractive site.

Below is an article from Fast Co Design that explains the process in detail.
If every moment in human history was a single steel ball, Histography is like an 4-D Newton's Cradle, visualizing how all of these events bump up and knock up against each other on a 14-billion-year time frame. It's beautifully hypnotic—and impressively, it's all sourced from Wikipedia, which means that it keeps on updating itself.
Created by Matan Stauber, Histography is an interactive timeline spanning the Big Bang to whatever was in the news yesterday. It basically draws all historical events from Wikipedia, visualizing each as a black dot. You can click on each dot to get more information about the event it represents. These dots are then ordered chronologically from left to right, with simultaneous events being stacked vertically on top of each other. The result is that the Histography looks something like a pointillist sound wave, growing and shrinking according to how noisy a year, era, or epoch was.
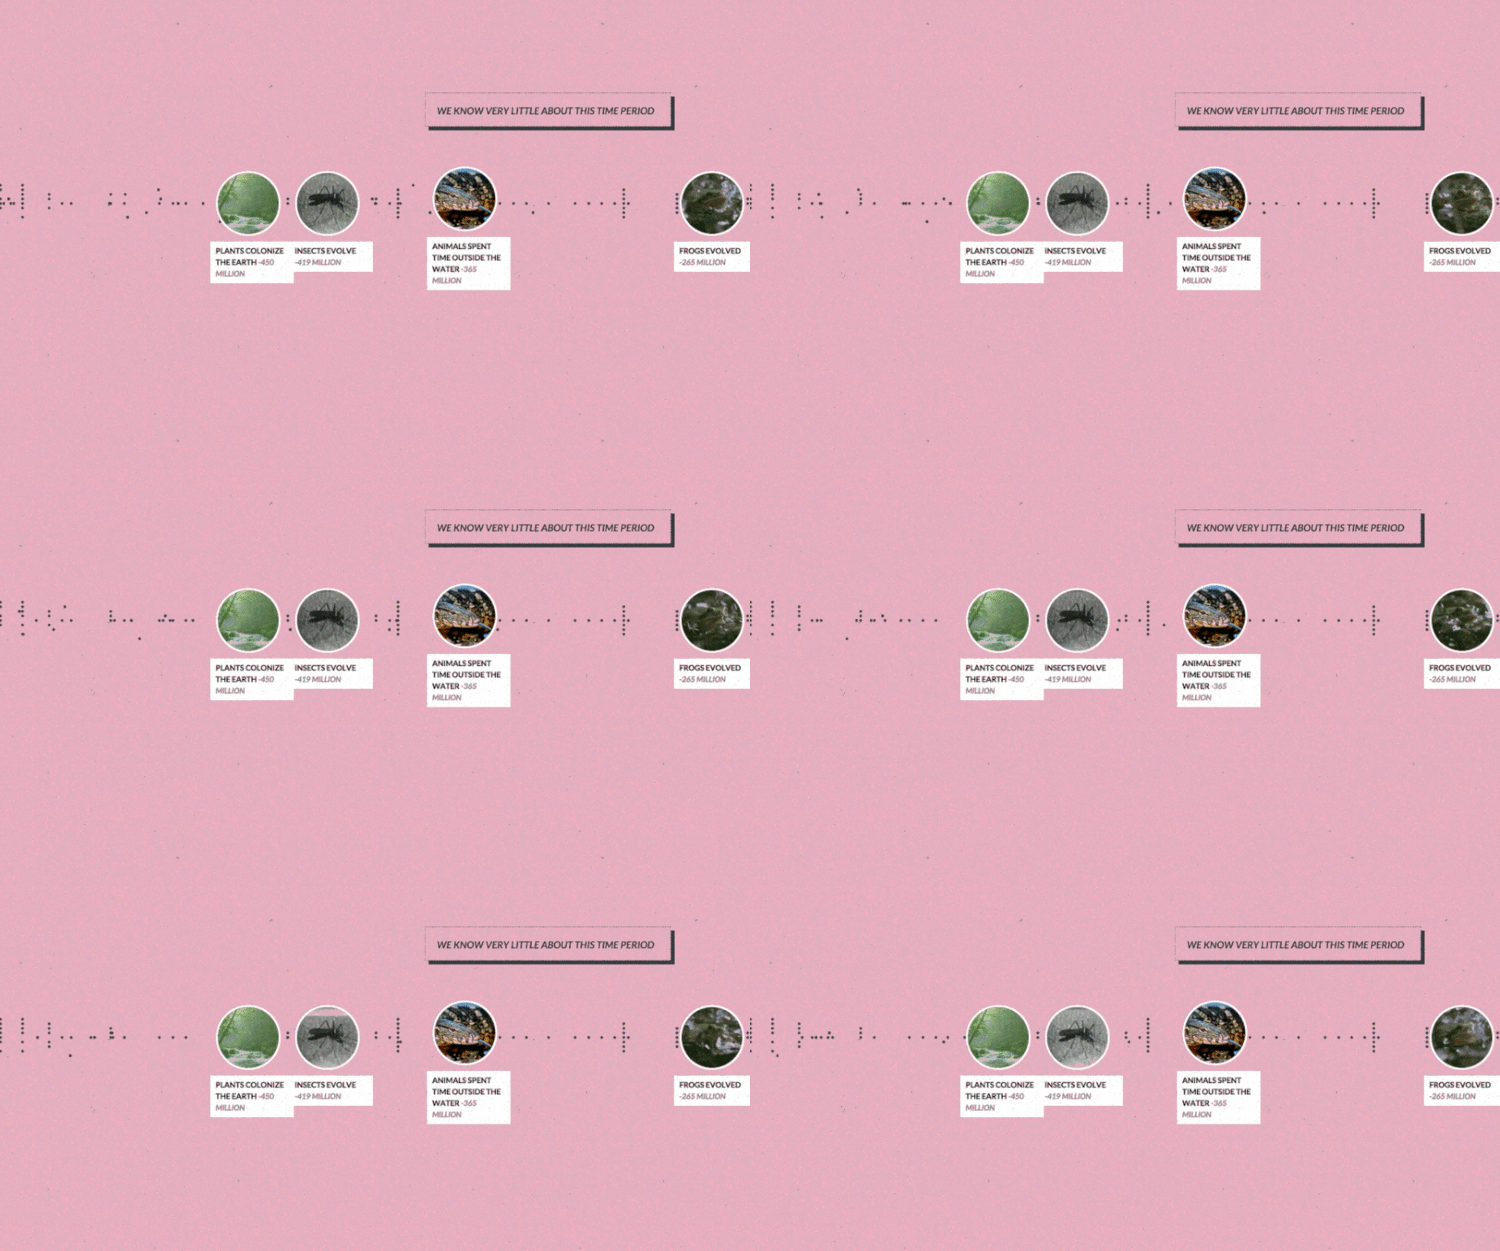
There's a number of different ways you can browse Histography. The default view shows every historical event from Wikipedia's database at once, which you can then filter down by category: for example, by literature, politics, assassinations, and so on. But I think the 'Editorial Stories' view (accessible by clicking the Histography logo) is more interesting. It represents Wikipedia's database as a nearly endless spiral, which you can descend through scrolling, zooming right down to the Big Bang.
Found on FastCo Design


 Randy
Randy

Reader Comments (1)