About
Randy Krum
President of InfoNewt.
Data Visualization and Infographic Design

Infographic Design

Infographics Design | Presentations
Consulting | Data Visualizations

DFW DataViz Meetup

Join the DFW Data Visualization and Infographics Meetup Group if you're in the Dallas/Fort Worth area!

Search the Cool Infographics site

Custom Search

Subscriptions:


Feedburner

The Cool Infographics® Gallery:

How to add the
Cool Infographics button to your:

Cool Infographics iOS icon

- iPhone
- iPad
- iPod Touch


Read on Flipboard for iPad and iPhone

Featured in the Tech & Science category

Flipboard icon

Twitter Feed
From the Bookstore

Caffeine Poster

The Caffeine Poster infographic

« Apple Product Flops Timeline #Fail | Main | Life Hacks for the Modern Traveller »
Tuesday
Mar102015

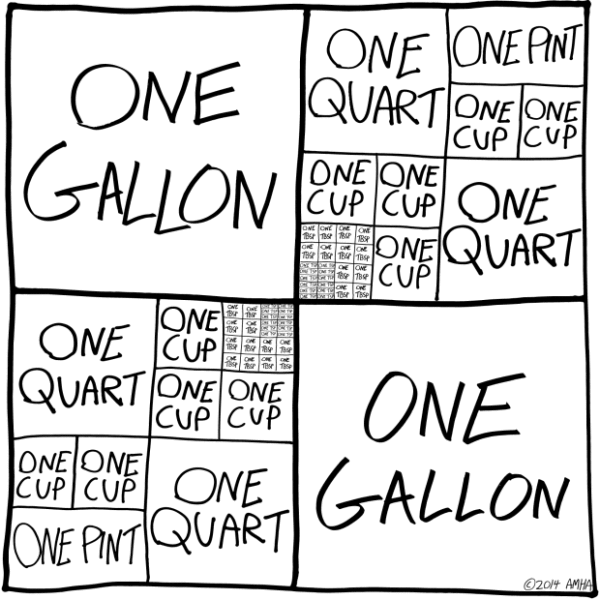
Baking Units Demystified

Baking Units Demystified infographic

Memorizing cooking unit conversions can be frustrating. Most of us just have a cheat sheet on the refrigerator that tells us that 1 Gallon= 4 Quarts. Well thanks to Andrew M.H. Alexander you might want to replace those boring magnets with the Baking Units Demystified infographic!

Infographics should simplify information and make it easier to understand without “dumbing it down.” This is a perfect example of showing the measuring relationships to make them easy to understand and even remember.

Found on Flowing Data.

PrintView Printer Friendly Version

EmailEmail Article to Friend

Reader Comments (1)

Enter your inform
February 14, 2017 | Unregistered Commenterronrogers
Editor Permission Required
While we are migrating to a new site design, you must have editing permission for this entry in order to post comments.