About
Randy Krum
President of InfoNewt.
Data Visualization and Infographic Design

Infographic Design

Infographics Design | Presentations
Consulting | Data Visualizations

DFW DataViz Meetup

Join the DFW Data Visualization and Infographics Meetup Group if you're in the Dallas/Fort Worth area!

Search the Cool Infographics site

Custom Search

Subscriptions:


Feedburner

The Cool Infographics® Gallery:

How to add the
Cool Infographics button to your:

Cool Infographics iOS icon

- iPhone
- iPad
- iPod Touch


Read on Flipboard for iPad and iPhone

Featured in the Tech & Science category

Flipboard icon

Twitter Feed
From the Bookstore

Caffeine Poster

The Caffeine Poster infographic

« Extremely Detailed 2016 Election Map | Main | Giveaway: 5W Information Graphics & Data Visualization Workshop Dallas »
Tuesday
Aug212018

How America Uses its Land

Here's How America Uses its Land infographic

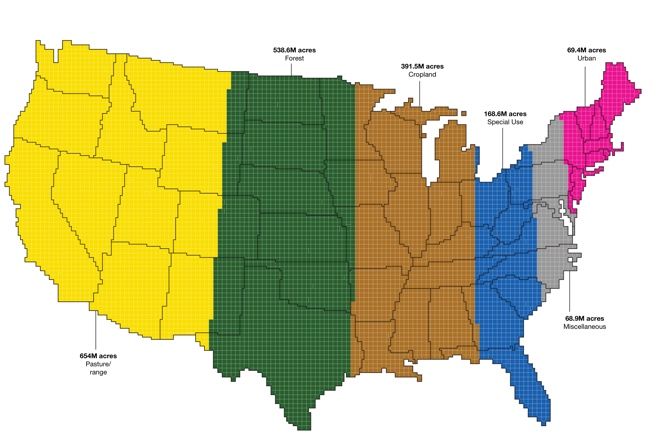
America's land use is very diverse and scattered throughout the states. By using surveys, satellite images and categorizations the U.S. Department of Agriculture divides the U.S. into six major types of land. Bloomberg took that data, and created the How America Uses its Land infographics. The infographics use the map to show both how much of the country is made up of a certain land use, and where the majority of it is located.

Using surveys, satellite images and categorizations from various government agencies, the U.S. Department of Agriculture divides the U.S. into six major types of land. The data can’t be pinpointed to a city block—each square on the map represents 250,000 acres of land. But piecing the data together state-by-state can give a general sense of how U.S. land is used.

Gathered together, cropland would take up more than a fifth of the 48 contiguous states. Pasture and rangeland would cover most of the Western U.S., and all of the country’s cities and towns would fit neatly in the Northeast.


Found on https://5wvelascoblog.com

PrintView Printer Friendly Version

EmailEmail Article to Friend

Reader Comments (6)

How the USA uses its land, actually. America is 2 continents, which include Canada and the whole of South America. An infographic should know this.
August 21, 2018 | Unregistered CommenterCm
I have a hard time with deserts and wetlands being combined into a single category, given the functions wetlands provide in filtering water. Combining non productive desert with highly productive wetlands obscures the losses in the latter land use
August 21, 2018 | Unregistered CommenterErut gudahl
These are "cool infographics" but horribly inaccurate 😂
August 22, 2018 | Unregistered CommenterTy
Inaccurate how? If you're going to make a claim like that against Bloomberg, you should back it up with your reasoning.
August 23, 2018 | Registered CommenterRandy
These are "cool infographics" but horribly inaccurate
September 10, 2018 | Unregistered Commenterturkiyemm
really it is cool
December 6, 2018 | Unregistered CommenterRaghava Thoreau
Editor Permission Required
While we are migrating to a new site design, you must have editing permission for this entry in order to post comments.