How Will You Make Your 2014 Numbers?
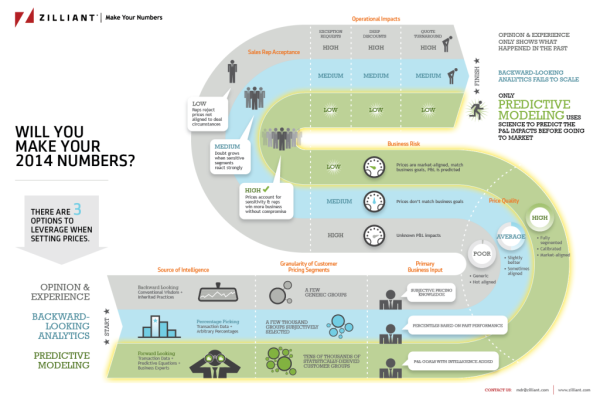
A good B2B infographic design, How Will You Make Your 2014 Numbers from Zilliant gives you 3 options to leverage when setting prices. Good luck making your numbers!
Pricing is the most powerful lever a company has to boost profitability, yet it is often the last bastion of guesswork in many companies.
When it comes to setting prices, what we typically see is that B2B companies take one of three distinct approaches: opinion and experience, backward-looking analytics and predictive modeling.
Where does your company fall? Take a peek at this infographic and find out!
I’m definitely seeing a big increase in design requests for B2B infographics that can be used in presentations, brochures and handouts. This design is a great example of showing how their service outperforms the alternatives. The design was sized to fit on standard size paper, so anyone can print it out. The racetrack path also walks the audience through the information in a very specific sequence.
Thanks to Danielle for sending in the link!


 Randy
Randy
