About
Randy Krum
President of InfoNewt.
Data Visualization and Infographic Design

Infographic Design

Infographics Design | Presentations
Consulting | Data Visualizations

DFW DataViz Meetup

Join the DFW Data Visualization and Infographics Meetup Group if you're in the Dallas/Fort Worth area!

Search the Cool Infographics site

Custom Search

Subscriptions:


Feedburner

The Cool Infographics® Gallery:

How to add the
Cool Infographics button to your:

Cool Infographics iOS icon

- iPhone
- iPad
- iPod Touch


Read on Flipboard for iPad and iPhone

Featured in the Tech & Science category

Flipboard icon

Twitter Feed
From the Bookstore

Caffeine Poster

The Caffeine Poster infographic

Entries in education (65)

Monday
Dec282009

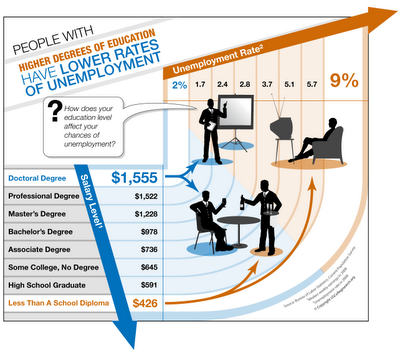
Higher Education = Lower Unemployment


From USCollegeSearch.org, a fairly simple but good chart showing the relationship between unemployment rates and education levels.  Although lacking a good title, this chart does a great job of communicating one message really well.

The Bureau of Labor Statistics has found that people who finish degree programs in college earn much more over the course of their lifetimes than those who only earn high school diplomas or drop out of college. Sometimes the difference can be over a million dollars before retirement.  But even more interesting, it was noted that people with undergraduate and graduate degrees manage to stay employed for longer periods, but also find jobs they qualify for more quickly.  They spend less time searching and more time working.


Thanks Jim!

Friday
Nov272009

Black Friday Deal! 3-for-1 posters at Flowing Prints


Nathan over at FlowingData and FlowingPrints is offering a special 3 posters for the price of 1 deal for Black Friday (offer good through Sunday 11/29).  That's all three posters for $20!

For readers of Cool Infographics to take advantage of the deal, go to FlowingPrints, click on the "Buy The Series" button and use the promotion code: bfridayfps20

The three posters all focus on Education, titled "College High", "Education: Enrollment and Dropouts" and "How America Learns: by the Numbers".  If not for yourself, think about buying a set for your local school or library!

The state of education in America is the theme of this series. With funds getting cut nationwide, it's important to know how today's youth are learning (or not learning).  We looked at over three decades of data from the National Center for Education Statistics (NCES). Education has seen a lot of improvement over the years, but there is still plenty of room for growth.
Also, for every print you buy, Nathan will send an additional one to a local school too!  Thanks Nathan!

Tuesday
Jun302009

Skirt Lengths on Flickr + infographic tutorial


Wendy Ding created this infographic in 2007, and recently published a complete tutorial on how she created it on Digital Arts.

After collecting data on skirt lengths and their wearers and locations from flickr.com, this information piece was created to illustrate the statistics. A bar graph, area map with call-outs, and a legend all come together to explain the skirt wearers relationship.

This piece garnered an honourable mention from the 2007 Adobe Design Contest for the digital illustration category.
Thanks for sharing Wendy!

Friday
Jun262009

Imagine Leadership, great infographic video


Great work from our friends at XPLANE.com for the Harvard Business School! Thanks to both XPLAE and Harvard for making this video available to the public.

The inspiring and thought-provoking piece on global leadership was created in collaboration with Nitin Nohria, Richard P. Chapman Professor of Business Administration, and Co-Chair of the Leadership Initiative at Harvard Business School.

The video debuted earlier this month at Harvard Business School's "How Can Leadership Be Taught" symposium on June 9 and 10. We were honored to partner with Nitin to create a visually appealing, provocative piece that would inspire viewers to take action, get involved and be motivated to lead.

"Imagine Leadership" is six minutes long and available for viewing on YouTube http://www.youtube.com/watch?v=TuuTlQ0FzEU. Inspired by the popular "Did You Know? 2.0" video that we created, the new piece has similar qualities in how it visually represents key factoids, people and critical information. However, unlike "Did You Know," this piece combines illustration with graphics and photography, allowing the most appropriate visual content to represent each subject.

Thursday
Jun182009

Videos online from the See Conference #4


A couple months ago (April 18th), the See Conference #4 was held in Wiesbaden, Germany.  This one-day event had a great lineup of speakers:  Aaron Koblin (Google Creative Lab), Julian Oliver (software artist), Gijs Joosen (ONL), Eric Rodenbeck (Stamen Design) and Prof. Dr. Gerhard Roth (University of Bremen).  The event was organized by Scholz & Volkmer (www.s-v.de).

The best part is that videos of the entire day of speakers are now available online from the event website at www.see-conference.com.  Some of the videos are in German, but Eric Rodenbeck, Julian Oliver, Gijs Joosen and Aaron Koblin are speaking English for their presentations.

Thanks Chantal!

Thursday
May212009

What is Wolfram|Alpha?

I'm not sure I understand what Wolfram|Alpha is yet, but so far it's pretty impressive.  Developed by Stephen Wolfram and his team, it claims to be a "computational knowledge engine".  The input box looks like a search engine, but it is definitely NOT a search engine.


When you type in a question, it attempts to show you all of the relevant data it can find.  It is actually calculating and charting this information real-time in order to present it to you.  Because its built on top of the Mathematica Engine, it can also handle math problems.


I think this will be an important tool for many designers of infographics, because you can get some of your raw data directly from Wolfram|Alpha.  As they add more data into the system over time, this will become one of your best resources for information.  They have a pretty extensive page of examples by category that is a great place to start.  Also watch the short video by Stephen Wolfram showing what the system can do.

Wednesday
Apr222009

How do College Students Spend Money?


 I certainly don't remember having 40% of my budget as "discretionary" when I was in college!

This is from the Westwood College website, but I don't see a specific creator listed.

Monday
Dec012008

Voyager Infographic video


Voyager from Jaime Arvizu on Vimeo.

Jaime Arvizu, a student at the Vancouver Film School, sent me a link to this infographic video that he and his team mates (Tyler Lemermeyer and Leo Aguiar) created for their Motion Design class.  You can find a high resolution version at Jaime's blog.

Thanks for sending this in Jaime, I love it!

Tuesday
Oct142008

VizThink 2009


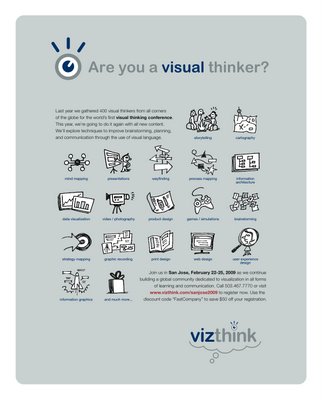
So VizThink Europe was this last weekend, and I came across this infographic ad in Fast Company magazine.  The next VizThink in the U.S. is coming up quickly.  February 22-25 in San Jose, CA.

Again, my friends at VizThink have created a discount code that I can offer to the readers of Cool Infographics!  Use the code BCRK01 to get $100 off of the standard registration price!

Special thanks to Ryan and the gang at VizThink!

$100 Off regular admission

DISCOUNT CODE: BCRK01

Thursday
Oct092008

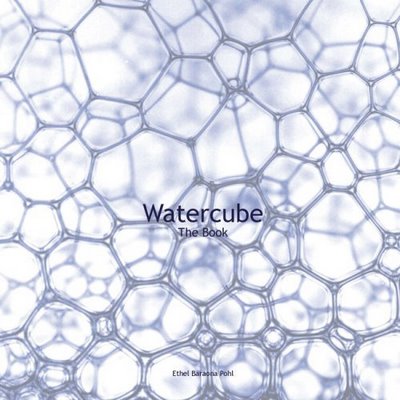
Watercube, The Book


Watercube, is a new book by Ethel Baraona Pohl.  The book is about the National Aquatics Centre built in Beijing for the 2008 Olympics, and has some cool infographics inside.  Some of the graphics were contributed by architect César Reyes Nájera.  A review of the book can be found here on www.v2com.biz
WATERCUBE: The Book is a complete monographic publication about the National Swimming Center for the Beijing Olympics 2008. With an exhaustive description about the Watercube we present a detailed study of the project. The book makes an holistic approach to the project that starts with a brief description of urban and social changes that China has been experienced in the last decade. These facts have encouraged the construction boom that made possible these kind of projects occur in cities like Beijing.

 
This page compared the amount of steel used to built the Watercube to some of the most well known buildings around the world.
This page shows a comparison to the same set of buildings around the world, but shows the tons of CO2 produced due to the steel used in their construction.


This page is one of the years of the timeline leading up to the construction of the Watercube.

Here you can buy Watercube, by Ethel Baraona Pohl, on Amazon.com.

Special thanks to Ethel for sharing the images from her book, and allowing me to post them on Cool Infographics!

Page 1 ... 2 3 4 5 6 ... 7 Next 10 Entries »