About
Randy Krum
President of InfoNewt.
Data Visualization and Infographic Design

Infographic Design

Infographics Design | Presentations
Consulting | Data Visualizations

DFW DataViz Meetup

Join the DFW Data Visualization and Infographics Meetup Group if you're in the Dallas/Fort Worth area!

Search the Cool Infographics site

Custom Search

Subscriptions:


Feedburner

The Cool Infographics® Gallery:

How to add the
Cool Infographics button to your:

Cool Infographics iOS icon

- iPhone
- iPad
- iPod Touch


Read on Flipboard for iPad and iPhone

Featured in the Tech & Science category

Flipboard icon

Twitter Feed
From the Bookstore

Caffeine Poster

The Caffeine Poster infographic

Entries in education (65)

Tuesday
Oct072008

Vampire Energy infographic video & chart

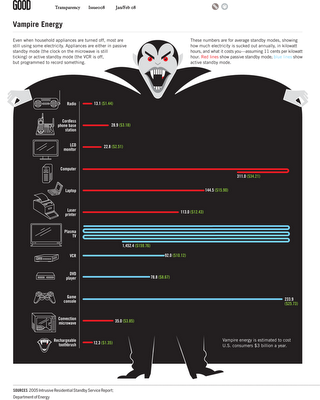
From GOOD magazine, they created an infographic video about Vampire Energy, all of the energy used by electronics in your house while you are not actively using them.  The chart itself from the magazine is fairly simple chart, but I really like it.  It's effective getting the message across with simple graphics.

Thursday
Aug282008

VizThink Europe Discount Code!


I know many of my readers would really enjoy the conference VizThink Europe, and the conference is coming up quickly.  The Europe version is in Berlin, Germany this year on October 12-14 at Crown Plaza Berlin City Centre.
We'll have lots of opportunities for hands on experiences, learning from industry gurus, and networking with your visual thinking peers. We'll be bringing a few of your favorite facilitators from San Francisco with all new content, plus a whole lot of new facilitators from Europe.
The great guys at VizThink have created a discount code for readers of Cool Infographics.  Use the code BCRK01 when you register to get €50 ($75-$80 in U.S. dollars these days) off any regular attendance fee (not student, Government or non-profit rates).

If you can get to Berlin (and I have a lot of readers from Europe), you would really get a lot from attending.

Big thanks to the guys at VizThink!

Saturday
Jun212008

Fly Through Airport Security


"How to...Fly Through Airport Security" illustration by Jason Lee from Wired Magazine, March 2008 (16.03).

You might as well check your dignity curbside. Soon you'll be shoeless and flustered, spilling comics across the floor as you dig your MacBook from the depths of your duffel. But take a deep breath, frequent fliers: It is possible to pass security with your ego intact. Here's how.

Tuesday
Jun032008

The Infographic that Saved a Million Lives


Great story from 37signals.com about a very simple infographic that motivated Bill and Melinda Gates to change the focus of their charity spending.

“No graphic in human history has saved so many lives in Africa and Asia,” says NY Times columnist Nicholas Kristof about an infographic in a ‘97 Times article that spurred Bill and Melinda Gates to take action on public health.

...But then bill confessed that actually it wasn’t the article itself that had grabbed him so much—it was the graphic. It was just a two column, inside graphic, very simple, listing third world health problems and how many people they kill. but he remembered it after all those years and said that it was the single thing that got him redirected toward public health.

Wednesday
May282008

The world as you've never seen it before


Check out WorldMapper! Above is a map of the world based on true Land Mass, but with WorldMapper, you can adjust the size of the countries based on whatever data you are trying to convey.

This is the world map based on Total Population:


This is the world map based on Total Computer Exports:


Alisa Miller, head of Public Radio International, talks about why -- though we want to know more about the world than ever -- the US news media is actually showing less. She uses WorldMapper to communicate her point about the state of today's news in the US.

Monday
May192008

LifeMap

Ritwik Dey charted out his life from age 6 to 24 as an infographic timeline project, and shared it on Flickr.

I just discovered Visual Think Map, which is where I found a link to the LifeMap. I added it to my blogroll on the right.

Thursday
Apr242008

Visualizing Carbon Dioxide Emissions

This is a great way to visualize gas emissions which are normally invisible. That's why most people don't have any real sense how much is produced by the things you do in everyday life like running your washing machine or refrigerator.

The black balloons really work, with the black color implying "bad" and they're actually filled with a lighter than air gas that rises into the atmosphere. I'm assuming that the size of the balloons actually represents the 50 grams of greenhouse gas discussed in the ad.

Found on infosthetics.com and radar.oreilly.com and the original is at www.saveenergy.vic.gov.au from the Australian government.

Sunday
Apr062008

A Brief Guide About Bridesmaids

Cool infographic video about (you guessed it) bridesmaids. Created by Yaniv Fridman, Nicolas Alexander and Amber MacKay for Motion Design Class at Vancouver Film School. Here's a link to the High Quality version of the video.

Their blog discusses the creative process and the tools they used to create the video.

Found on infosthetics.com

Tuesday
Apr012008

Visualizing Pi (π)


Cool little GIF animation to visualize the value of Pi (π) from Wikipedia. Click the image to view the animation.

Found on digg.com

Sunday
Mar232008

Map of Creativity


Check out the Map of Creativity from the Next Generation Foundation.

The Map of Creativity is a user-friendly, interactive database of innovative educational projects throughout the world.