Made in France
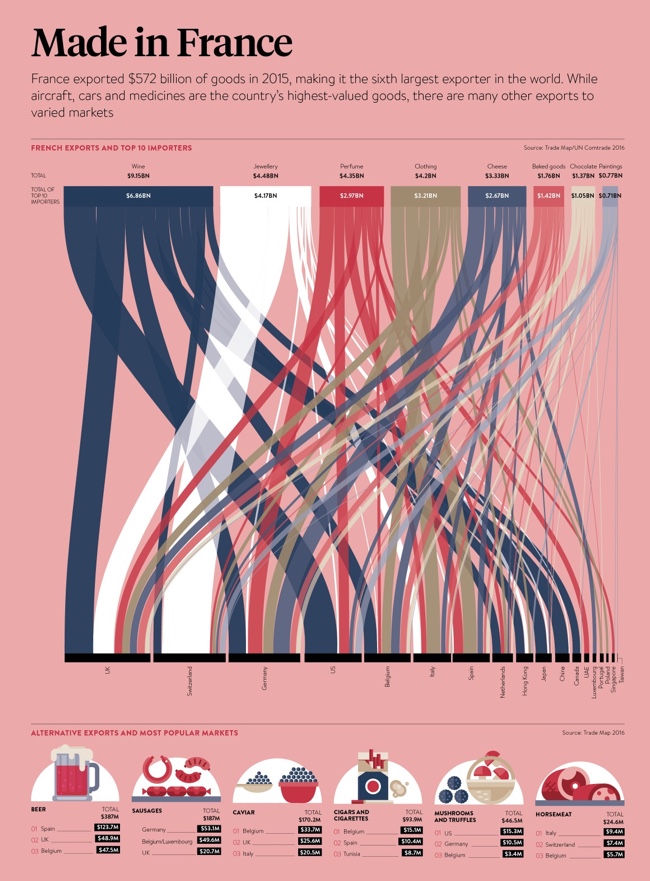
The Made In France infographic by Raconteur uses a Sankey Diagram to plot the many-to-many relationships of top exports with top destination countries.
Infographic outlining French exports and top 10 importers, alternative exports including caviar, cigars and horsemeat and most popular markets
France exported $572 billion of goods in 2015, making it the sixth largest exporter in the world. While aircraft, cars and medicine are the country's highest-value goods, there are many other exports to varied markets.
I'm confused by the introductory paragraph. I don't see aircraft, cars or medicine in the data visualization or represented anywhere else. Did they just choose 8 random product categories they wanted to include?
Showing the two separate values for "Total Exports" and "Total of Top 10 Importers" is confusing. Especially when the Top 10 value is shown within the sankey diagram, but broken apart and connected to the 18 countries shown across the bottom of the visualization.
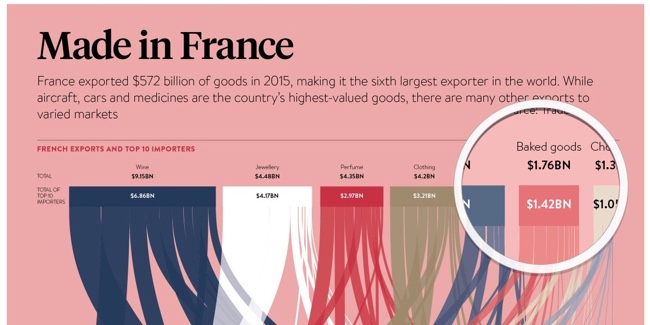
I really appreciate the magnifying glass interactive feature on the landing page! I like this approach better than the standard zooming interface you soo on many other large, complicated infographics.


 Randy
Randy
