


The Beautiful Flow of Pi
 Randy
Randy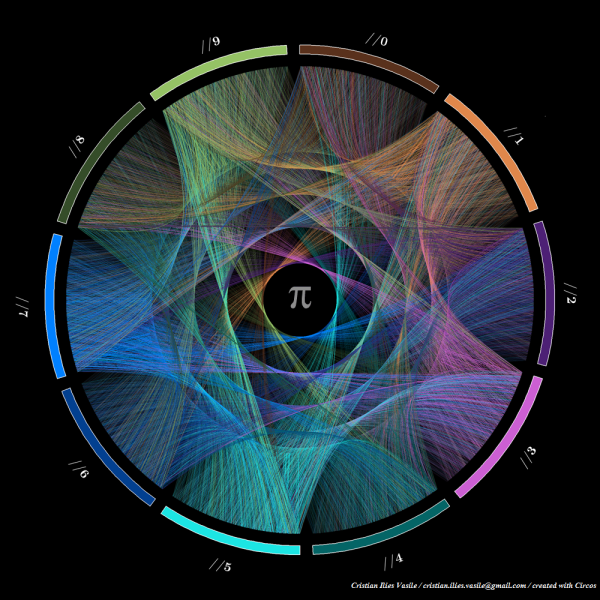
Flow Of Life Flow Of Pi. Cristian Ilies Vasile designed this visualization of the first 1,000 digits of the mathematical constant pi using Circos to plot the sequence of digits…in a circular pattern of course!. You can buy a print copy of the poster for $22 from Fine Art America. Cristian has create a few different varieties of the artwork that you can see on his page.
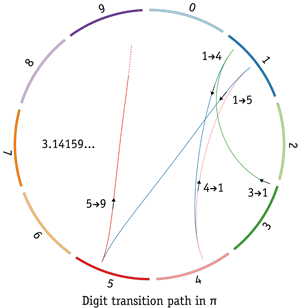
Starting with the first digit “3”, a connecting arc is drawn to each subsequent digit (3.14159265358979323846…). Since the sequence is theorized to be a random sequence, it creates a beautiful visualization that appears evenly distributed among the digits. Check out this explanation by Martin Krzywinski along with some of his own artwork. He demostrates the sequence with this visualization of just the first five digits 3.14159…
I had not heard of Circos before, so I have now added a link to it on the Cool Infographics Tools page.
Thanks to Matt Baker for posting on Google+
