About
Randy Krum
President of InfoNewt.
Data Visualization and Infographic Design

Infographic Design

Infographics Design | Presentations
Consulting | Data Visualizations

DFW DataViz Meetup

Join the DFW Data Visualization and Infographics Meetup Group if you're in the Dallas/Fort Worth area!

Search the Cool Infographics site

Custom Search

Subscriptions:


Feedburner

The Cool Infographics® Gallery:

How to add the
Cool Infographics button to your:

Cool Infographics iOS icon

- iPhone
- iPad
- iPod Touch


Read on Flipboard for iPad and iPhone

Featured in the Tech & Science category

Flipboard icon

Twitter Feed
From the Bookstore

Caffeine Poster

The Caffeine Poster infographic

Entries in pollution (15)

Friday
Aug222008

Beijing Air Quality Index


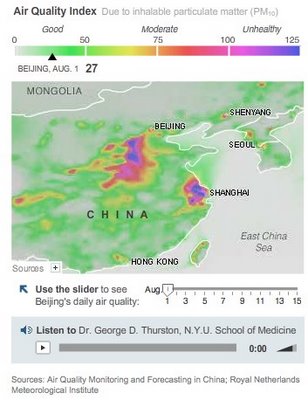
NYTimes.com is also tracking the Air Quality Index by day during the Olympics using a heatmap style graphic.  There's definitely more pollution and particles in the air than most of the participants are used to.  So far, there have been a couple of days in the 90's, but didn't cross over 100 into the "unhealthy" range.

Thursday
Apr242008

Visualizing Carbon Dioxide Emissions

This is a great way to visualize gas emissions which are normally invisible. That's why most people don't have any real sense how much is produced by the things you do in everyday life like running your washing machine or refrigerator.

The black balloons really work, with the black color implying "bad" and they're actually filled with a lighter than air gas that rises into the atmosphere. I'm assuming that the size of the balloons actually represents the 50 grams of greenhouse gas discussed in the ad.

Found on infosthetics.com and radar.oreilly.com and the original is at www.saveenergy.vic.gov.au from the Australian government.

Thursday
Nov222007

TheGlobalWarming Infographic


TheGlobalWarming Infographic, originally uploaded by Seungho.

Found on Flickr by Seungho.

Thursday
Oct182007

Plastic Bags


Here's another one from Chris Jordan. Is it art, or is it infographic?

The image shows 60,000 plastic bags, which is how many bags are used in the U.S. every 5 seconds! The picture currently on display at the Paul Kopeikin Gallery in Los Angeles is 5ft x 6ft large so viewers can step up close to see all of the details.

Thursday
Oct042007

Breathing Earth


Breathing Earth is a cool website that displays international statistics in real-time, similar in concept to Poodwaddle.com's World Counter. Breathing Earth focuses on carbon dioxide emissions by country and adds population, births and deaths.

Welcome to Breathing Earth. This presentation displays the carbon dioxide emission levels of every country in the world, as well as their birth and death rates - all in real-time. Though considerable effort has been taken to ensure that the presentation uses the most accurate and up-to-date data available, please remember that this is just a simulation.
Breathing Earth was created by David Bleja (aka Stillwater), whose home website is stillwater-microcosm.net

Found on SimpleComplexity.net

Page 1 2