About
Randy Krum
President of InfoNewt.
Data Visualization and Infographic Design

Infographic Design

Infographics Design | Presentations
Consulting | Data Visualizations

DFW DataViz Meetup

Join the DFW Data Visualization and Infographics Meetup Group if you're in the Dallas/Fort Worth area!

Search the Cool Infographics site

Custom Search

Subscriptions:


Feedburner

The Cool Infographics® Gallery:

How to add the
Cool Infographics button to your:

Cool Infographics iOS icon

- iPhone
- iPad
- iPod Touch


Read on Flipboard for iPad and iPhone

Featured in the Tech & Science category

Flipboard icon

Twitter Feed
From the Bookstore

Caffeine Poster

The Caffeine Poster infographic

Entries in population (46)

Thursday
Jan072010

Population of the Dead - infographic


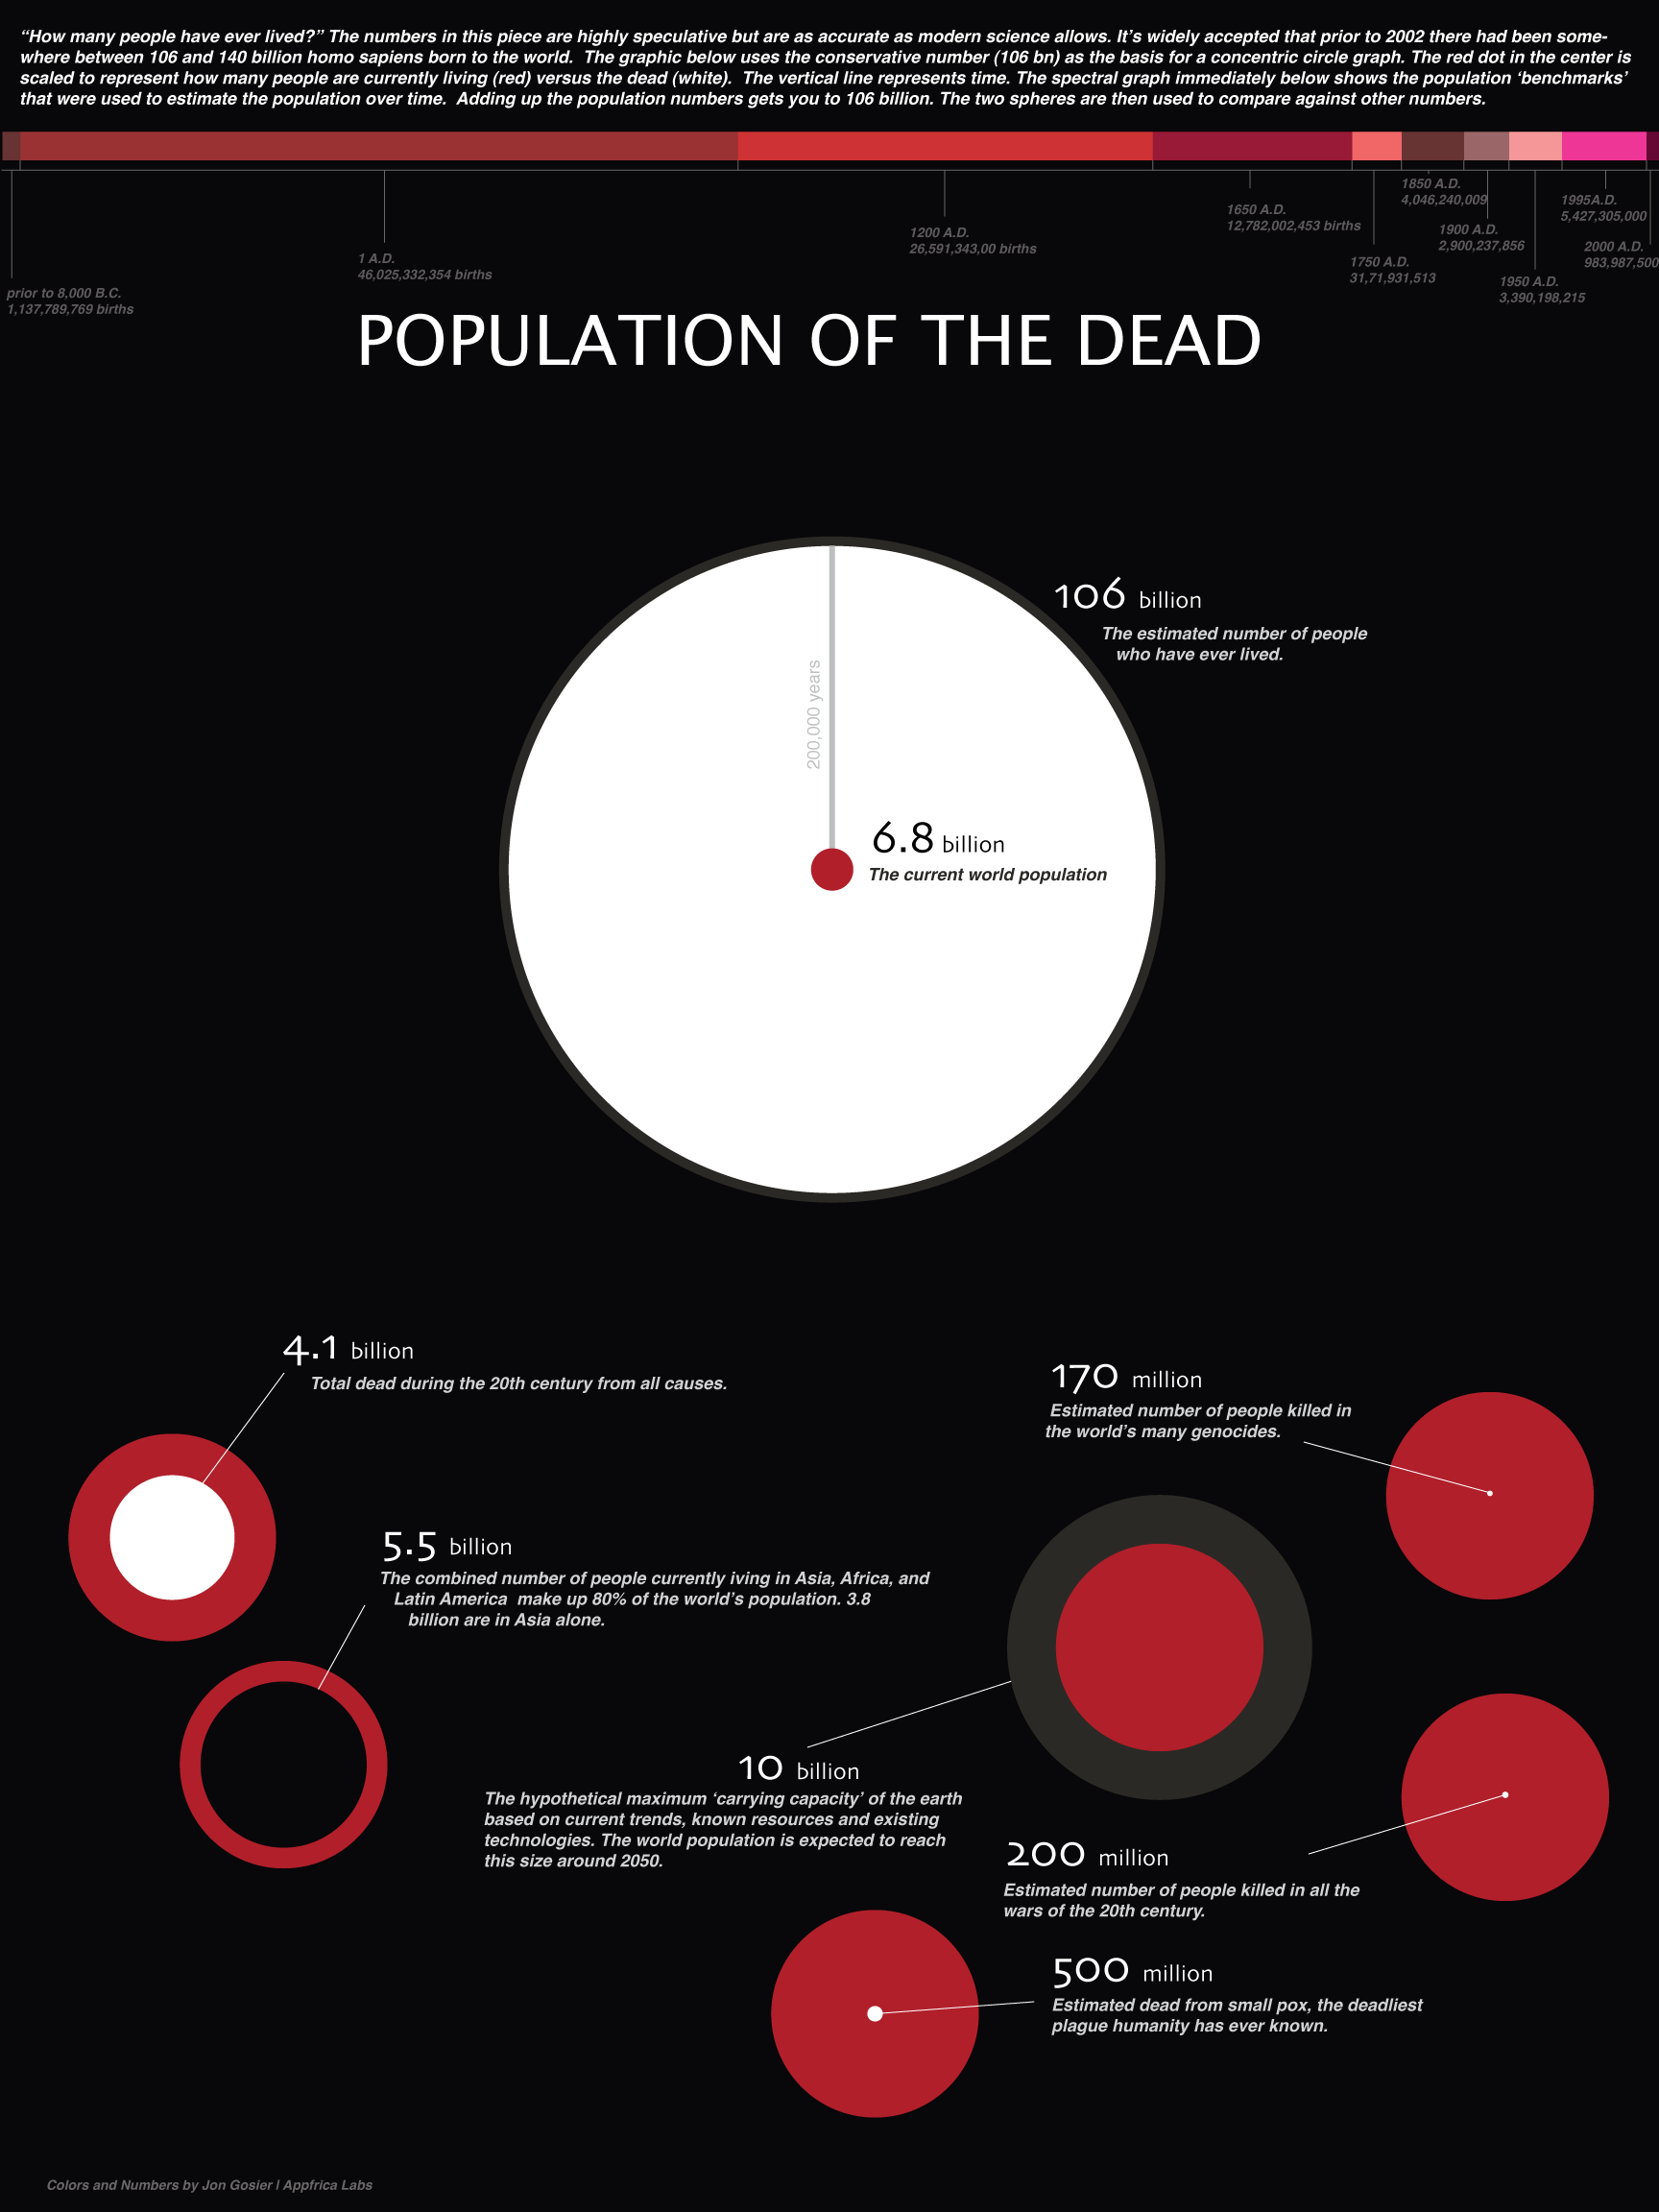
Jon Gosier, from Appfrica.com, created this infographic, Population of the Dead, to help visualize the question “How many people have ever lived?”  Across the top is also a timeline of births, that helps demonstrate how quickly the population has accelerated in the last few hundred years.


Text from the image:

The numbers are highly speculative but are as accurate as modern science allows. It’s widely accepted that prior to 2002 there had been somewhere between 106 and 140 billion homo sapiens born to the world. The graphic below uses the conservative number (106 bn) as the basis for a concentric circle graph. The red dot in the center is scaled to represent how many people are currently living (red) versus the dead (white). The vertical line represents time. The spectral graph shows the population ‘benchmarks’ that were used to estimate the population over time. Adding up the population numbers gets you to 106 billion. The two spheres are then used to compare against other numbers.

Wednesday
Jul292009

Overpopulation: The Making of a Myth [infographic video]

Thursday
May212009

What is Wolfram|Alpha?

I'm not sure I understand what Wolfram|Alpha is yet, but so far it's pretty impressive.  Developed by Stephen Wolfram and his team, it claims to be a "computational knowledge engine".  The input box looks like a search engine, but it is definitely NOT a search engine.


When you type in a question, it attempts to show you all of the relevant data it can find.  It is actually calculating and charting this information real-time in order to present it to you.  Because its built on top of the Mathematica Engine, it can also handle math problems.


I think this will be an important tool for many designers of infographics, because you can get some of your raw data directly from Wolfram|Alpha.  As they add more data into the system over time, this will become one of your best resources for information.  They have a pretty extensive page of examples by category that is a great place to start.  Also watch the short video by Stephen Wolfram showing what the system can do.

Thursday
May142009

Who is Coming to America?


From GOOD magazine.  If you look closely, this is essentially a bar chart dressed up, but it's the dressing up into the shape of the U.S. flag that catches your eye.  I love it!
Immigration may have taken a back seat during the financial crisis, but the issue still needs resolving. While illegal immigrants sneaking over the border is still a primary concern, it’s good to know who came to our country legally, and from where. Our latest Transparency is a look at the 20 countries from which the most people came to America in 2008, how many immigrants already had family here, and how many received asylum when they arrived on our shores.
Found on SimpleComplexity.net, thanks Nathan!

Wednesday
Apr292009

How Long Will It Last?


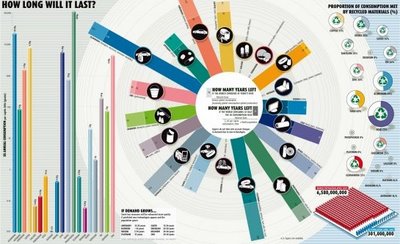
Good infographic from the New Scientist showing how many years we have left of our key natural resources.  Essentially these are basic bar and pie charts, but dressed up to make the overall graphic more compelling.  The message is still clear though, and the author gets his point across very strongly.

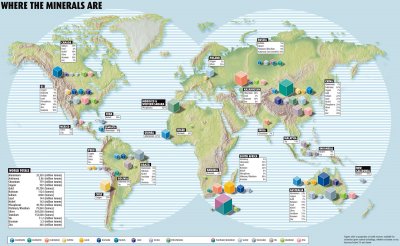
This comes from a 2007 article in the New Scientist called "Earth's Natural Wealth: an Audit" that include two more infographics as well.  The first is a map of where in the world are these natural resources are.


The next is a bubble graphic showing the scale of how much of each resource an average American will consume during their lifetime.


The Source listed on the first infographic: Armin Reller, University of Augsburg, Tom Graedel, Yale University

Found on FlowingData.com and numerous Twitter references.  Thanks Nathan.

Friday
Apr172009

Where's The Beer? (U.S. Breweries per Capita)


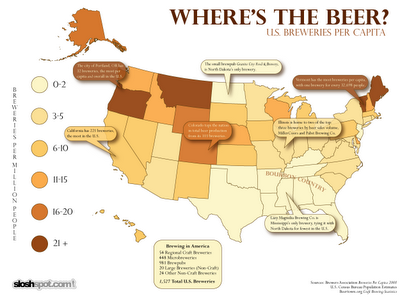
Found on SloshSpot.com, a U.S. map showing breweries per capita by state.  Drink up!

Thursday
Apr022009

Build Your Own Infographic World Map


Why is another world popoulation map website Cool?  Because on GunnMap, by Gunn Interactive, you can load your own data.   There are a few example data sets preloaded like population, GDP growth, military spending and birth rate, but the best part is that you can paste in your own data to create a custom world map.

Here's a quick demo video from Arthur Gunn on how to use the site by pasting in data from the CIA website to create a new map:


GunnMap demo from Arthur Gunn on Vimeo.

Thanks Paul for the link!

Friday
Mar132009

Humans!

Watch more cool animation and creative cartoons at aniBoom

Here's a fun one for Friday.  Humans!  by Reza Rasoli.  Reminds me of The Matrix when Mr. Smith calls the humans a virus on the world.

Humans! is a 60 second global awareness PSA sensationalizing the excessive, all-consuming nature of the human being. This cute and naive Earth stands no chance against such an insatiable parasite. Witness its utter demise in a fun and sickening kind of way.
Thanks Hannu for the link!

Monday
Mar022009

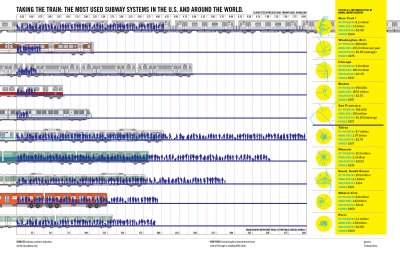
Taking the Train

It's not a complicated one, but I like Good Magazine's summary of the biggest train systems in the world (top 5 U.S. cities and top 5 foreign cities).  The silhouettes represent the daily rides in the city, and the length of the train shows how many miles that system covers.  To the right is a quick map of each city's subway system and some statistics about their subway system.

Thanks Li, for sending in the link!

Tuesday
Dec232008

Immigration to the U.S. 1820-2007


Immigration to the US, 1820-2007 v2 from Ian Stevenson on Vimeo.

Cool video by Ian Stevenson (hosted on Vimeo) that animates the origins and number of people that immigrated to the U.S. every decade from 1820 to 2007.

Thanks Garrett for the link!