


Population of the Dead - infographic
 Randy
Randy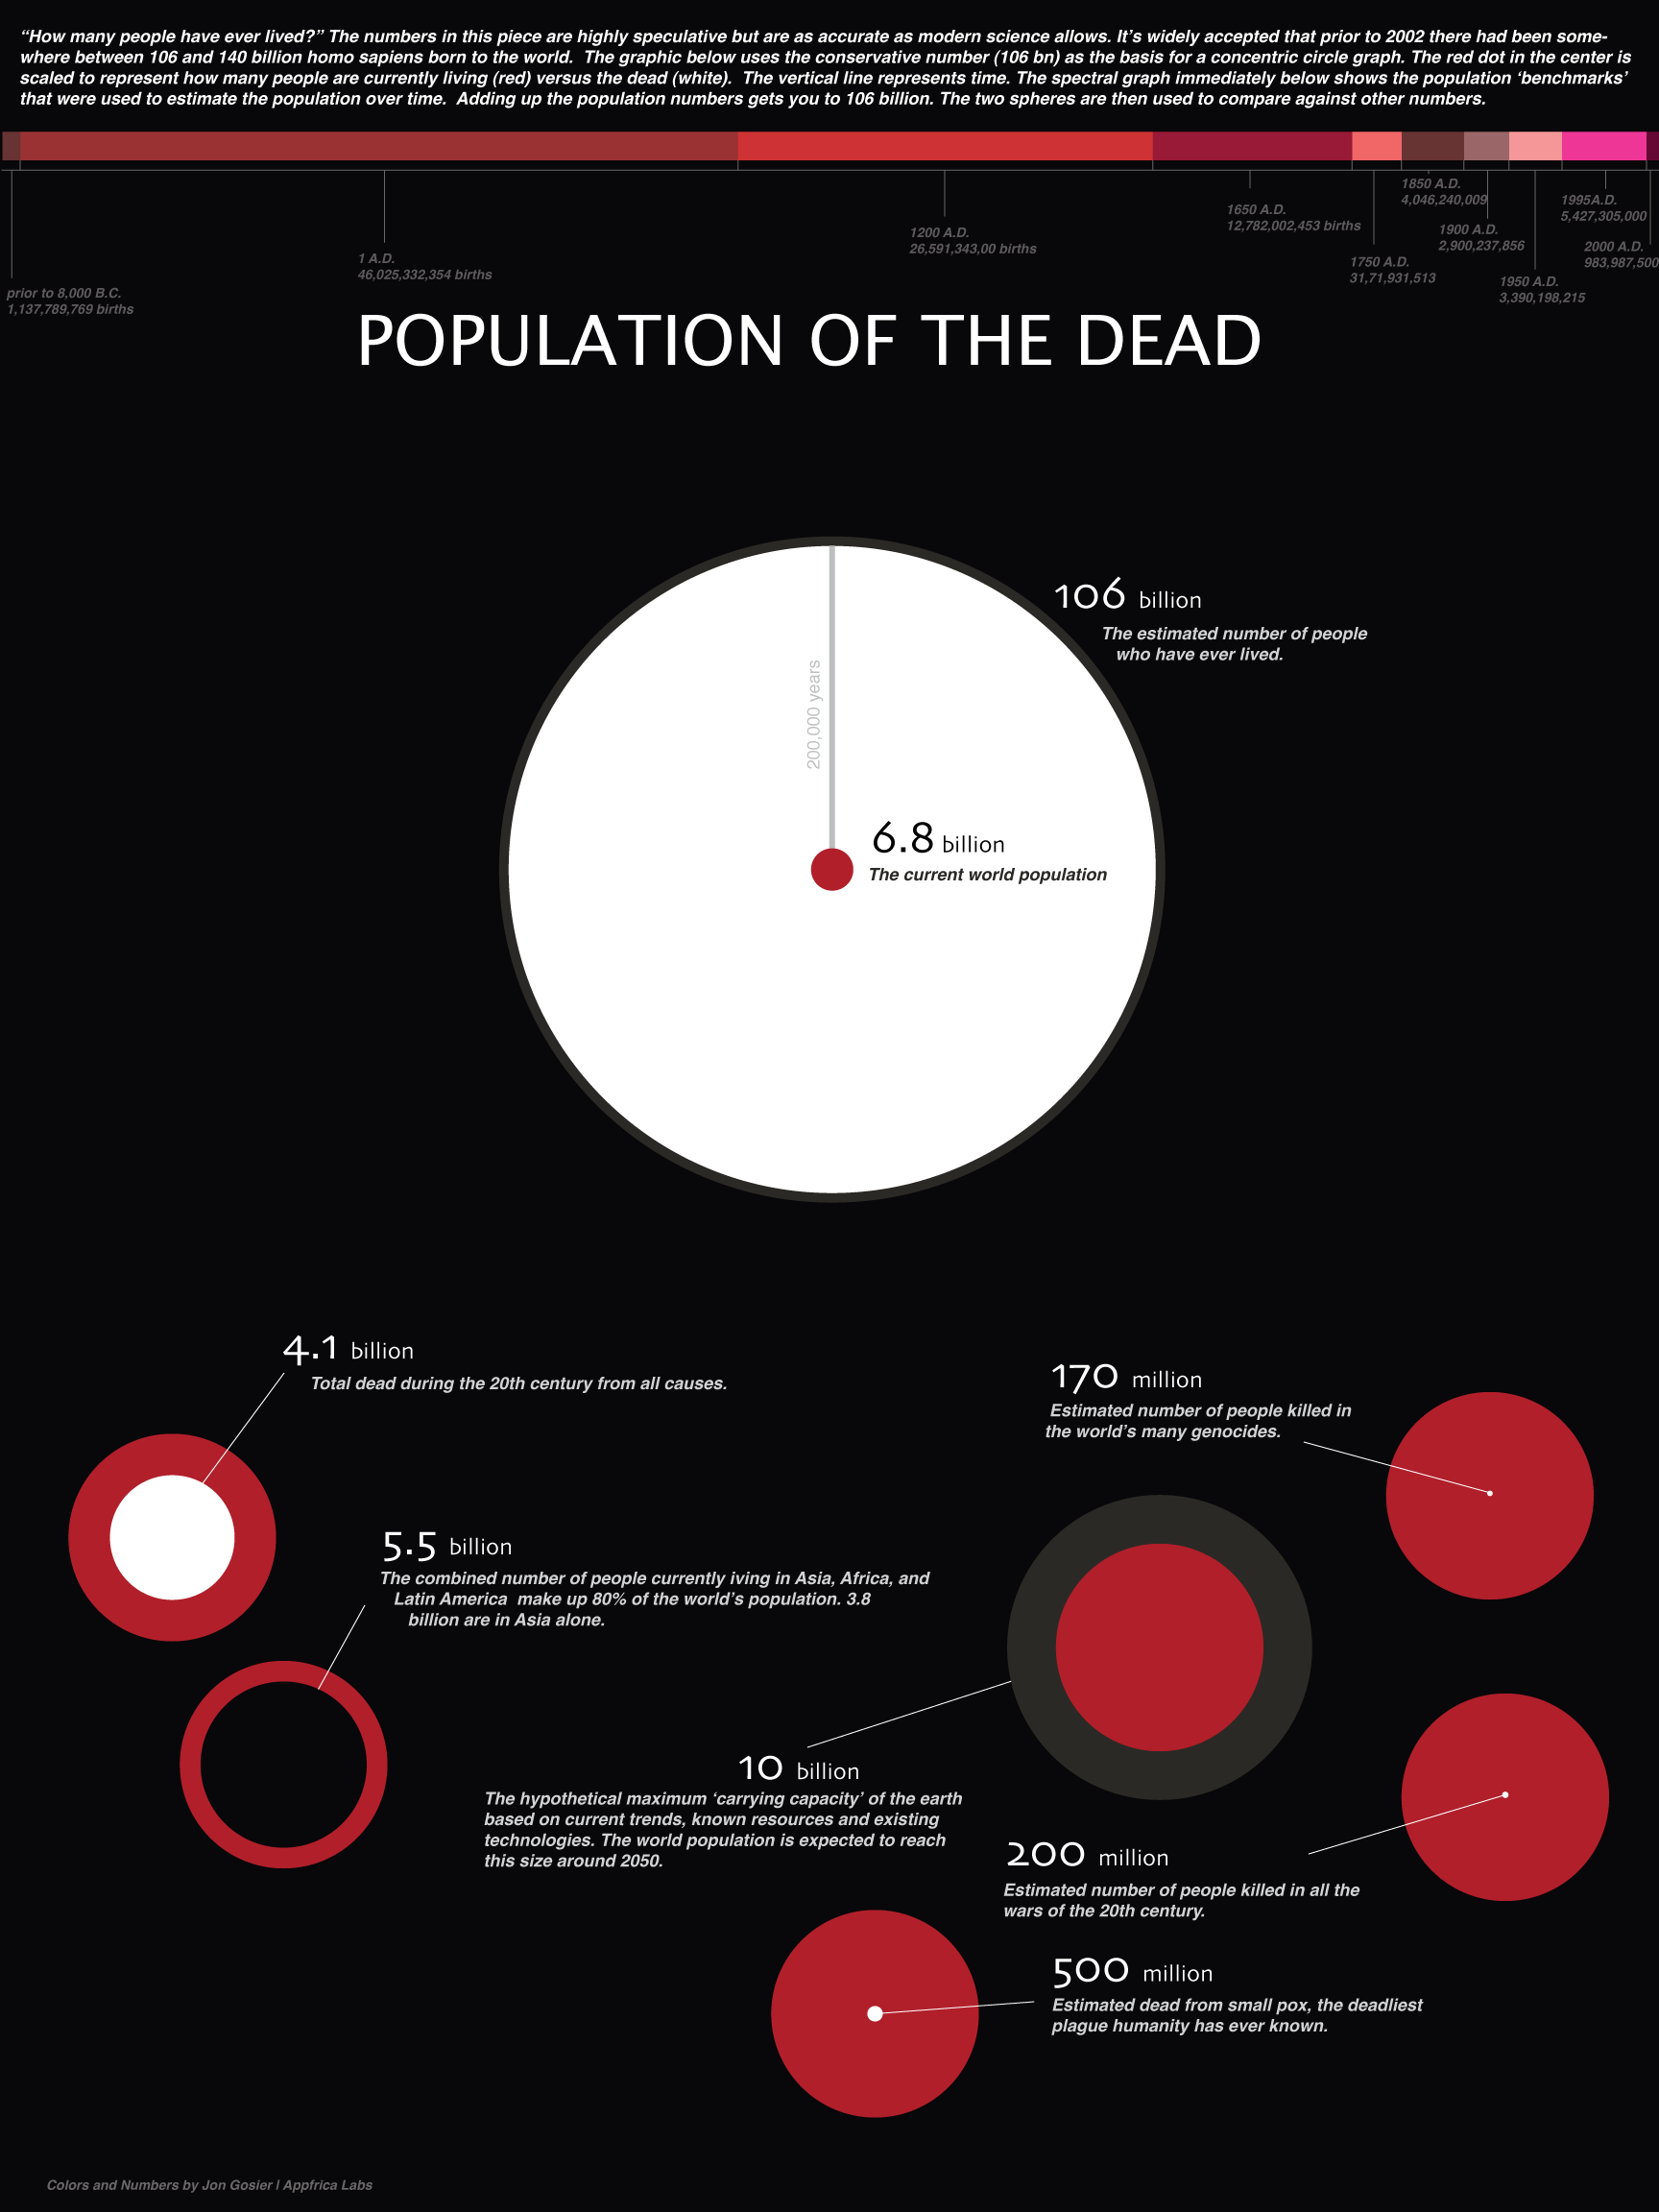
Jon Gosier, from Appfrica.com, created this infographic, Population of the Dead, to help visualize the question “How many people have ever lived?” Across the top is also a timeline of births, that helps demonstrate how quickly the population has accelerated in the last few hundred years.
![]()
Text from the image:
The numbers are highly speculative but are as accurate as modern science allows. It’s widely accepted that prior to 2002 there had been somewhere between 106 and 140 billion homo sapiens born to the world. The graphic below uses the conservative number (106 bn) as the basis for a concentric circle graph. The red dot in the center is scaled to represent how many people are currently living (red) versus the dead (white). The vertical line represents time. The spectral graph shows the population ‘benchmarks’ that were used to estimate the population over time. Adding up the population numbers gets you to 106 billion. The two spheres are then used to compare against other numbers.

Reader Comments (2)
Actually, I thought this was an awful infographic when I went to explore it in detail. The red and white is not used consistently to show dead / alive. The proportions of the circles to each other have no relationship. Great idea but poorly executed.
It is very hard to estimate the life expectancy in the Dark Ages and the number of a family's members. This is a good endeavor tho