About
Randy Krum
President of InfoNewt.
Data Visualization and Infographic Design

Infographic Design

Infographics Design | Presentations
Consulting | Data Visualizations

DFW DataViz Meetup

Join the DFW Data Visualization and Infographics Meetup Group if you're in the Dallas/Fort Worth area!

Search the Cool Infographics site

Custom Search

Subscriptions:


Feedburner

The Cool Infographics® Gallery:

How to add the
Cool Infographics button to your:

Cool Infographics iOS icon

- iPhone
- iPad
- iPod Touch


Read on Flipboard for iPad and iPhone

Featured in the Tech & Science category

Flipboard icon

Twitter Feed
From the Bookstore

Caffeine Poster

The Caffeine Poster infographic

« Population of the Dead - infographic | Main | Digital Podge 09 - Fantastic infographic website design »
Wednesday
Jan062010

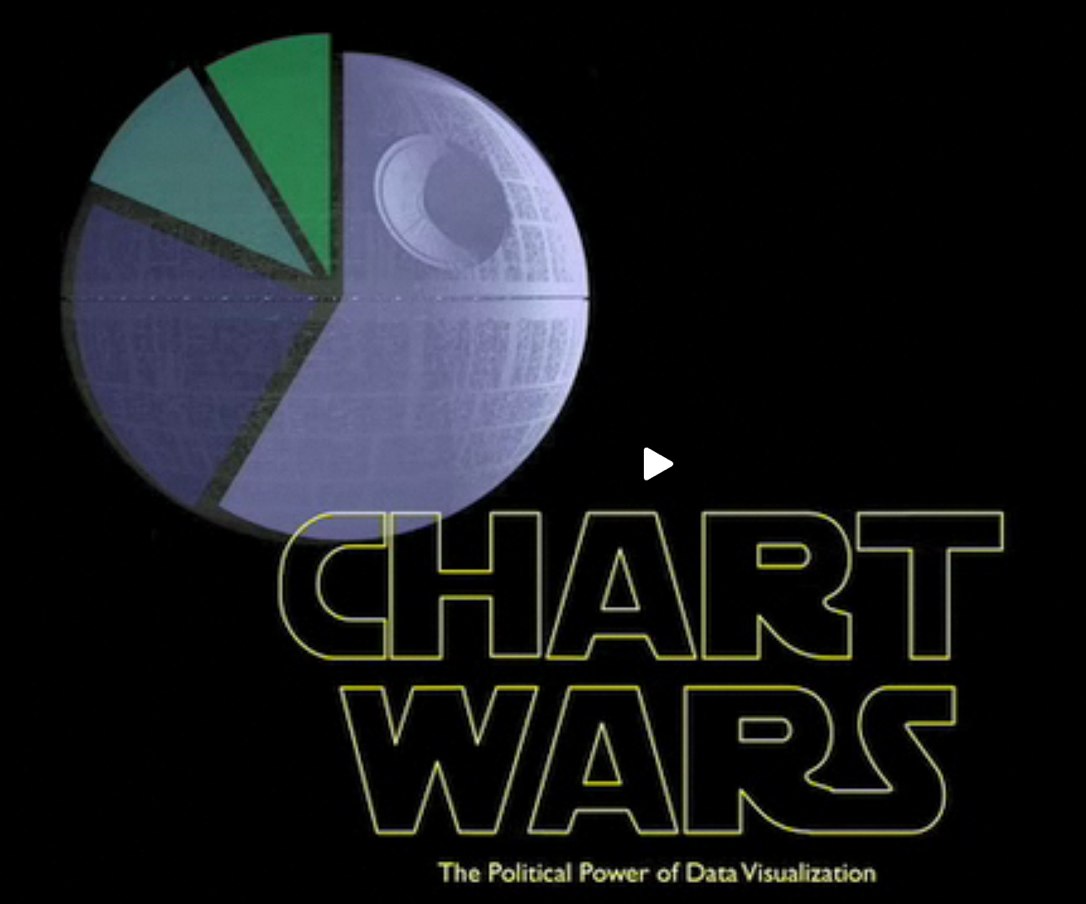
Chart Wars: The Political Power of Data Visualization

Chart Wars is a great, short (5:15) presentation by Alex Lundry on the political power of data visualization and some of the issues surrounding using charts and infographics to promote a specific agenda.  Inspired title slide too.  Nice job Alex!

TargetPoint’s VP and Director of Research, Alex Lundry, was recently a featured speaker at DC Ignite, an evening of short presentations in which participants are limited to 5 minutes and precisely 20 slides that auto-advance every 15 seconds.


Thanks to Dave Gray for tweeting a link!

PrintView Printer Friendly Version

EmailEmail Article to Friend

Reader Comments (1)

Loving the way you are merging star wars and politics. Excelent metafor.
Editor Permission Required
While we are migrating to a new site design, you must have editing permission for this entry in order to post comments.