


SwissLeaks: the map of the globalized tax evasion
 Randy
Randy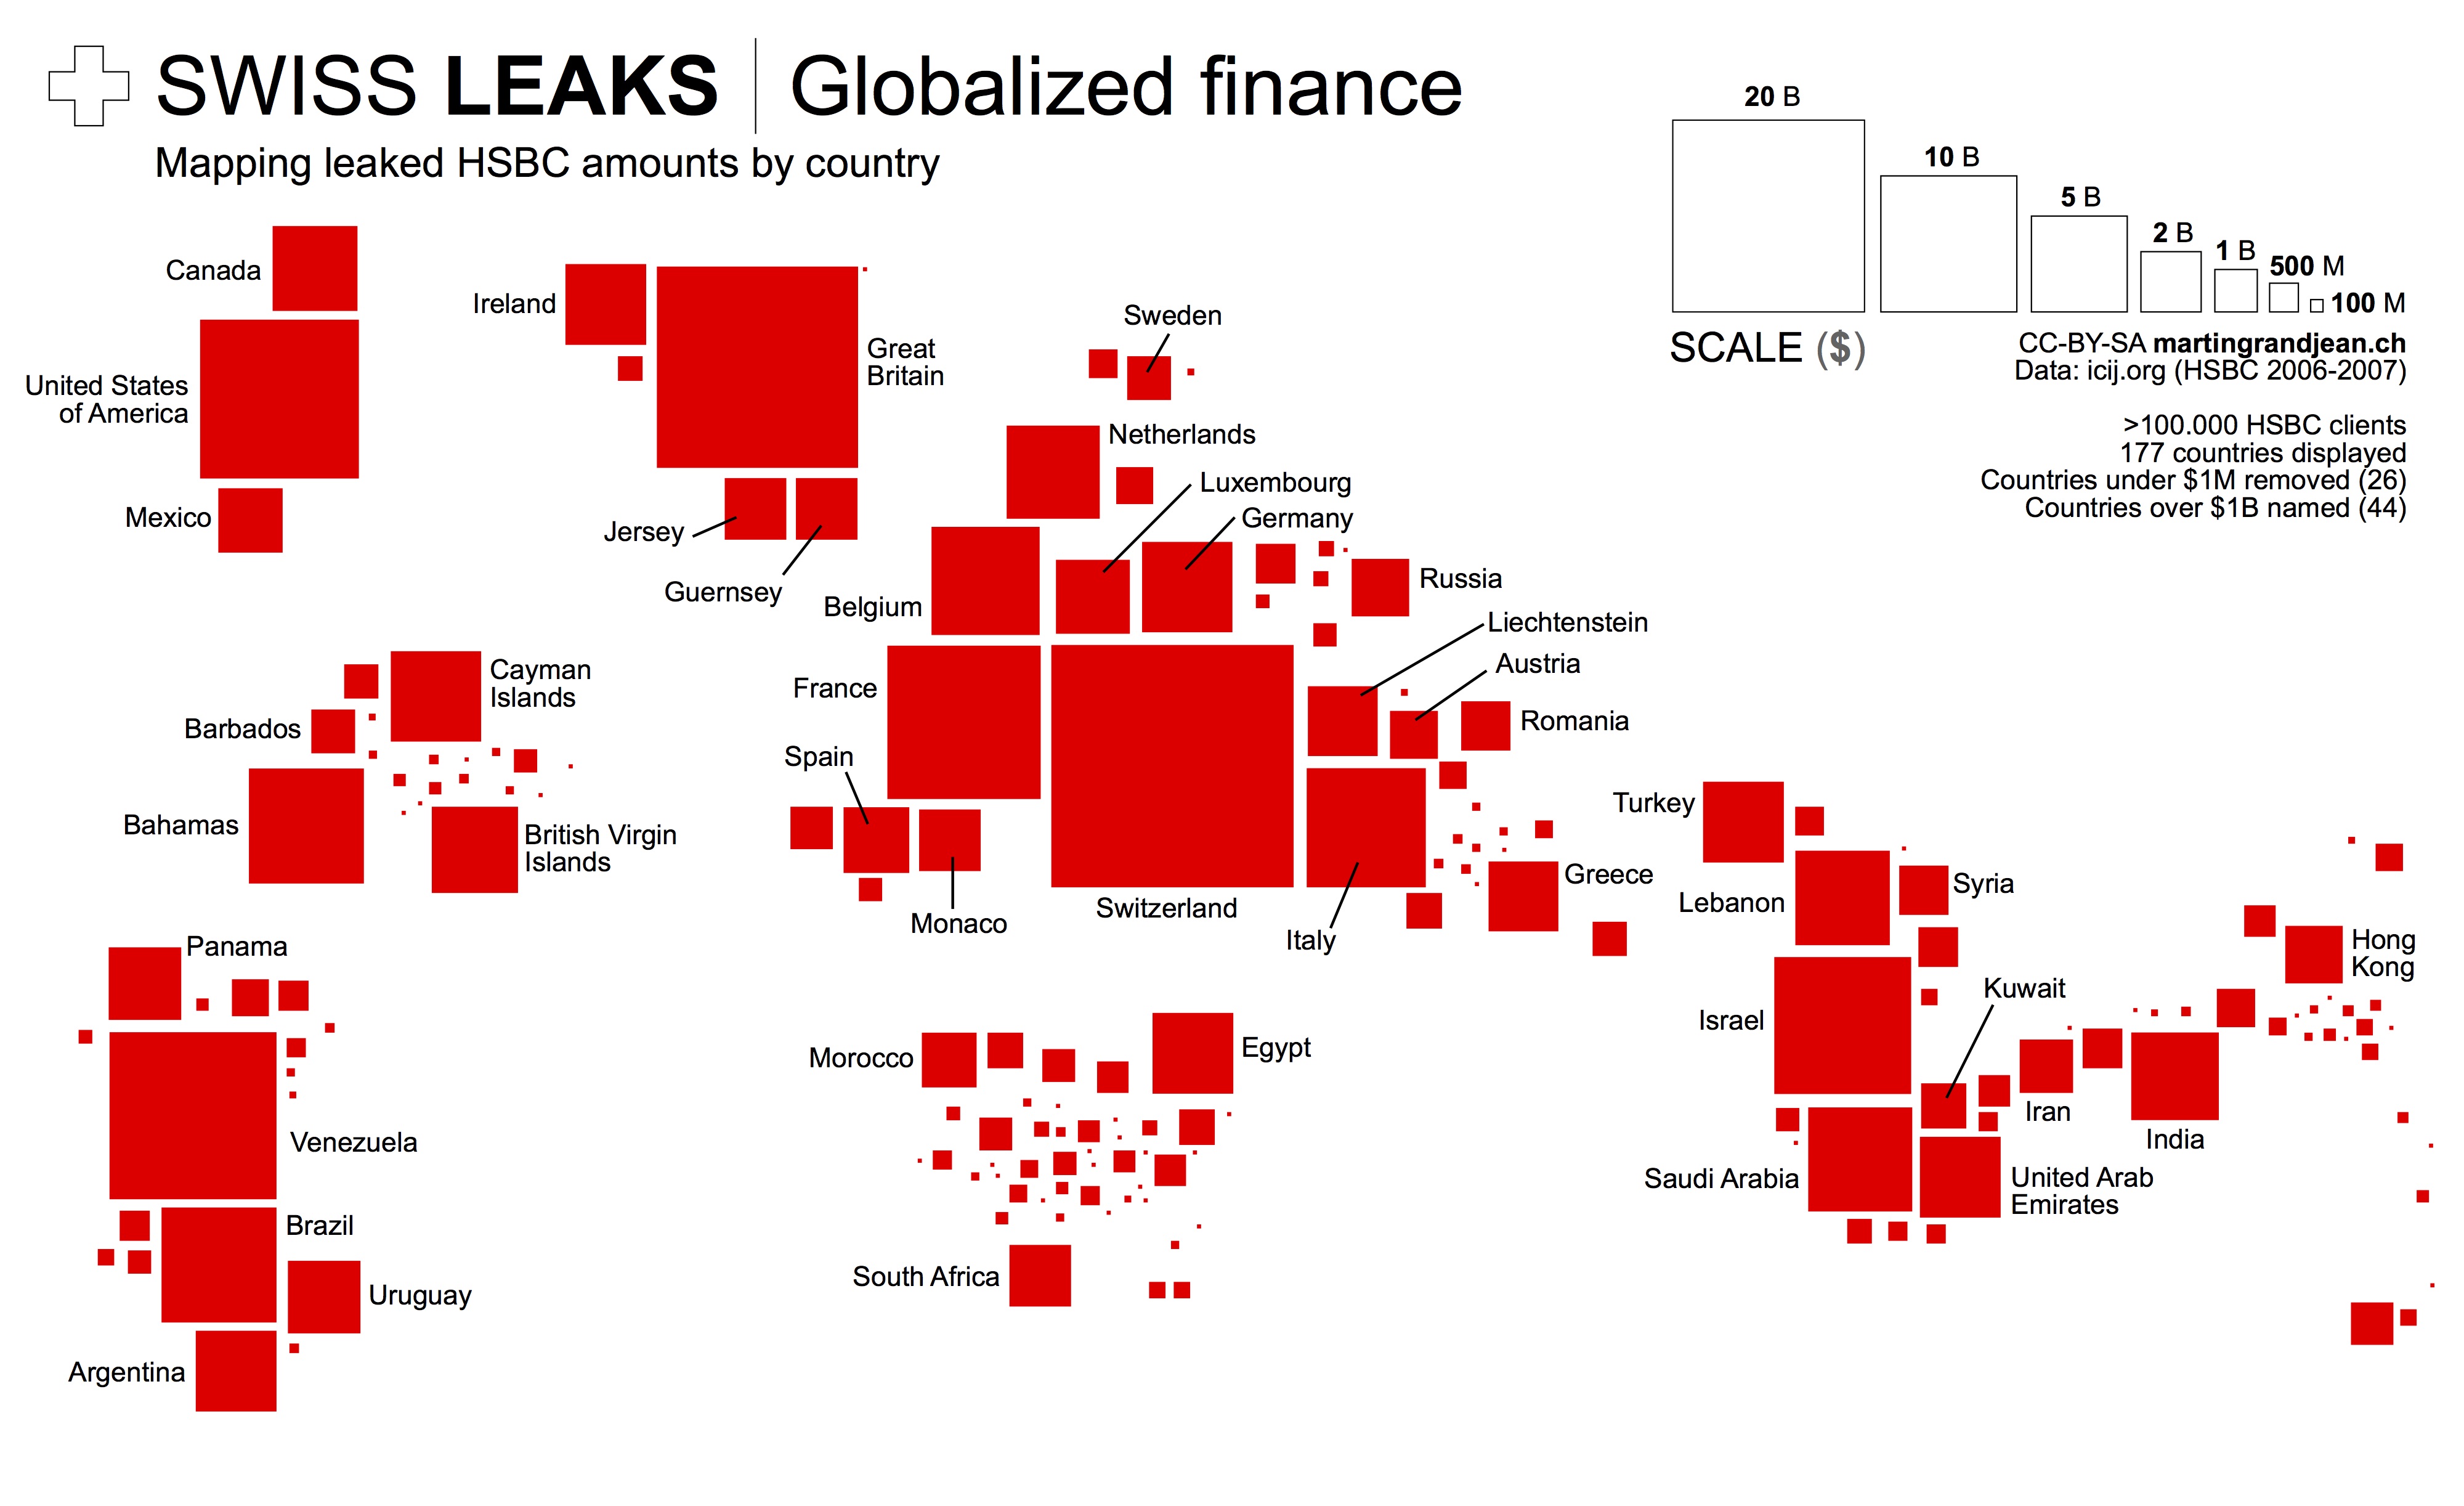
SwissLeaks: the map of the globalized tax evasion infographic from Martin Grandjean shows the countries that were affected the most by the HSBC "Swiss Leaks" data.
HSBC “Swiss Leaks” data shared by the International Consortium of Investigative Journalists reflect the globalization of tax evasion. While billions of dollars are inconceivable, mapping the origin of bank account holders allows an overview. This map is only a small contribution to the understanding of the Swiss Leaks data.
Why this map?
This map does voluntary not strictly stick to the geographical reality. It is a response to too many maps published in the media these days that are made unreadable by regrettable graphic choices: top-ten limited, overlapping points, colored territories (small countries and islands disappear), etc.
What does it show?
The number of affected countries and their diversity is very important. Note the strong presence of the Caribbean. In proportion to their population, South and East Asia are very poorly represented, while the Middle East is over-represented. The strong presence of “tax havens” is explained by the use of intermediates by the holders of bank accounts.
A great example of using the area of the squares to represent the amounts.
Created by Martin Grandjean
