About
Randy Krum
President of InfoNewt.
Data Visualization and Infographic Design

Infographic Design

Infographics Design | Presentations
Consulting | Data Visualizations

DFW DataViz Meetup

Join the DFW Data Visualization and Infographics Meetup Group if you're in the Dallas/Fort Worth area!

Search the Cool Infographics site

Custom Search

Subscriptions:


Feedburner

The Cool Infographics® Gallery:

How to add the
Cool Infographics button to your:

Cool Infographics iOS icon

- iPhone
- iPad
- iPod Touch


Read on Flipboard for iPad and iPhone

Featured in the Tech & Science category

Flipboard icon

Twitter Feed
From the Bookstore

Caffeine Poster

The Caffeine Poster infographic

Entries in video (137)

Monday
Jul262010

How Does Diet Soda Cause Weight Gain? [infographic video]

Another great use of infographics, illustrations and visual examples used in a video to better communicate a message.  How Does Diet Soda Cause Weight Gain? is a video from Wellness-Works.net.  I wish they would credit the artist so we knew who made the video for them.

An informative, fun video about the importance of your food’s pH and its impact on your health.

Wednesday
Jun162010

Facebook's Secret Strategy Infographic

Art: Audrey Fukuman

There was some controversy when Facebook CEO Mark Zuckerberg unintentionally revealed the 2010 Facebook Strategy Infographic that was printed on the inside liner of his hoodie at the D8 conference.  Audrey Fukuman at SFWeekly.com has recreated the infographic based on the video and photos.

Photo via AllThingsD/Anna Mathat

According to SFWeekly.com, this was a hoodie given to all Facebook employees.

I expect some disagreement, but I’m a firm believer that you can absolutely design an infographic to represent a strategy, a concept or a qualitative result.  Infographics don’t have to be based only on a massive amount of quantitative, numeric data.  What do you think, does this qualify as an infographic?

Here’s the video clip from the AllThingsD D8 conference when Mark removed the hoodie and revealed the graphic:

Found on SFWeekly.com and digg.com

Thursday
May132010

Visualizing "Drive", an illustrated presentation by Dan Pink

Great job by the RSA (The Royal Society for the encouragement of Arts, Manufactures and Commerce) to visualize and illustrate this presentation given by Dan Pink, author of Drive: The Surprising Truth About What Motivates Us.

This is definitely walking the fine line between illustration and infographics, but I thought it was worthy to share.  I think the presentation is much more engaging with the visuals.  I wish I knew who the designer was so I could give him credit.

More illustrated videos are available on the RSA Videos page.


If anyone is interested in buying Dan’s book, this link will help support Cool Infographics.

Monday
May102010

Apple, Adobe Flash and H.264 - an infographic explanation

Enrique Serrano (@eserranocom) designed this tall banner-style infographic, Apple, Flash and H.264, to help explain the conflict between Apple and Adobe Flash.  There’s a lot of history between these two mega-companies, and even after Apple posted Steve Job’s Thoughts on Flash, it’s still not easy to understand what’s going on.

Since so much has been said about not having Flash support in the devices of Apple(mainly the Apple iPhone and the iPad) I put together as much facts as possible about Apple, Adobe, the iPhone and Flash, plus some on video codecs including Theora, H.264 and HTML 5 video.

I hope these infographics help you better understand the big picture with the current situation of these technologies and companies.

Mixing a timeline, bar charts, 100 circles, a couple pie charts and some illustrations, Enrique does a good job of covering most of the angles between Apple and Adobe.

Originally posted on Treble Click, found on Social Media Graphics.

Monday
May032010

Lies, Damned Lies and Statistics (about TEDTalks)

Very funny video from TEDActive, by Sebastian Wernicke that analyses the best and worst of TEDTalks using statistics and word analysis.

In a brilliantly tongue-in-cheek analysis, Sebastian Wernicke turns the tools of statistical analysis on TEDTalks, to come up with a metric for creating “the optimum TEDTalk” based on user ratings. How do you rate it? “Jaw-dropping”? “Unconvincing”? Or just plain “Funny”?

Found on ILoveCharts.tumblr.com

Thursday
Apr222010

Follow the Money - infographic video

Follow the Money” is a video summarizing the results from the project by Northwestern University grad students Daniel Grady and Christian Thiemann.  Using data from the website Where’s George?, they have been able to track the movement of U.S. paper currency.  What can you learn from this?  That there are natural borders within the U.S. that don’t necessarily follow state borders, and it can also be used to predict the spread of disease because it maps movement of people within the U.S.

From Maria Popova on BrainPickings.org: This may sound like dry statistical uninterestingness, but the video visualization of the results is rather eye-opening, revealing how money — not state borders, not political maps, not ethnic clusters — is the real cartographer drawing our cultural geography.  The project was a winner at the 2009 Visualization Challenge sponsored by the National Science Foundation and AAA.


From Manuel Lima on VisualComplexity.com: Some places, such as Los Angeles, California, have many bills passing through it from across the nation, while others, such as Anderson County in Tennessee - Grady’s home - have bills circulating mainly within a more local neighborhood. Shown here are images from the video.  The data from the Where’s George? project is in fact so pertinent that is also being used by researchers to predict the spread of flu across the United States.

You can see the Northwest project site, which has a much more adademic title “Community Structure in Multi-Scale Transportation Networks”.

Rendered using Processing 1.0.6.  Found on VisualizingEconomics.com, VisualComplexity.com and Maria Popova has a good article on BrainPickings.org.

Friday
Apr022010

The State of the Internet [infographic video]

JESS3 / The State of The Internet from JESS3 on Vimeo.


The State of the Internet is a great infographic video by JESS3 for the JESS3 lecture at AIGA Baltimore in Feb 2010.  

Friday
Mar262010

Japan - The Strange Country [infographic video]

Japan-The Strange Country (English ver.) from Kenichi on Vimeo.

Created by Kenichi Tanaka for his final thesis project, Japan - The Strange Conutry is an infographic video exploring the statistics about Japan and the Japanese people. Available in both English and Japanese language versions.

You can see Kenichi’s work on his design website or his blog.


Thanks to mobarts for the link!

Friday
Feb262010

The History of Olympic Pictograms [video]


NYTimes.com posted this video by designer Steven Heller called “Olympic Pictograms Through the Ages”.  You may not agree with Steven’s opinions on which icons were better than others, but it is fascinating that every city for every olympics has tried to redesign the icons to add their own visual personality (with the exception of Montreal in 1976 that reused the icons from 1972).

Designer Steven Heller traces the evolution of the tiny symbols for each Olympic sport since their appearance in 1936.


Found on FlowingData and VizWorld

Monday
Feb012010

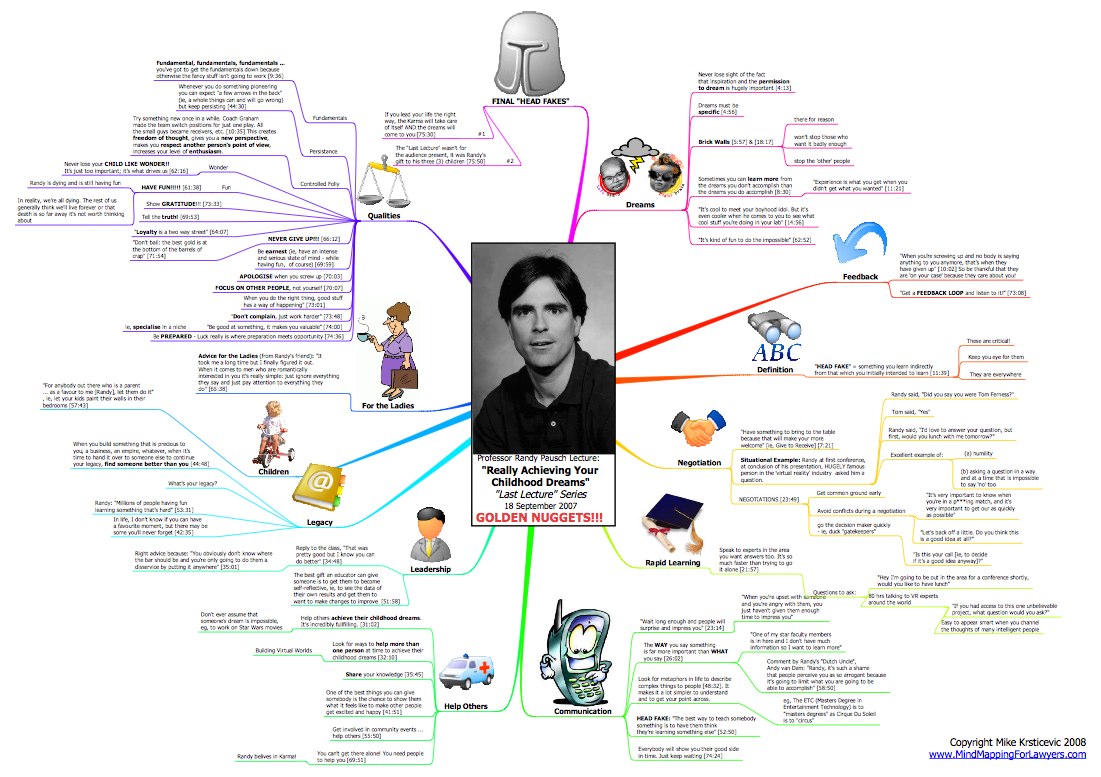
Mindmap of Randy Pausch's Last Lecture

Mike Krsticevic has created a great mindmap based on Randy Pausch’s Last Lecture.  

At the age of only 45 (in Sept 2006), Professor Pausch was told that only 4% of pancreatic cancer sufferers (of which he was now diagnosed as one) lived for 5 years after their diagnosis. At the time of the “Last Lecture”, due to his deteriorating medical condition, Professor Pausch was told his odds had reduced to 3 to 6 months of good health left (at best). 

I have spent 3 hours preparing the mind map for you (including the time spent re-watching the video) and I have learnt so much more by being actively involved. For this reason I strongly recommend that you take the time to read and study the mind map after you watch the video. I believe it will be well worth your time

If you haven’t seen this video, I highly recommend watching this.  It’s about 1:15 long, so watch it over lunch or when you have enough time, but it is truly inspirational.

You can download the PDF from Mike’s site.