About
Randy Krum
President of InfoNewt.
Data Visualization and Infographic Design

Infographic Design

Infographics Design | Presentations
Consulting | Data Visualizations

DFW DataViz Meetup

Join the DFW Data Visualization and Infographics Meetup Group if you're in the Dallas/Fort Worth area!

Search the Cool Infographics site

Custom Search

Subscriptions:


Feedburner

The Cool Infographics® Gallery:

How to add the
Cool Infographics button to your:

Cool Infographics iOS icon

- iPhone
- iPad
- iPod Touch


Read on Flipboard for iPad and iPhone

Featured in the Tech & Science category

Flipboard icon

Twitter Feed
From the Bookstore

Caffeine Poster

The Caffeine Poster infographic

Entries in wealth (24)

Monday
May052008

Where Does the Money Go?


From the nytimes.com, this graphic visually represents how average consumer spending breaks down, and the color code shows how much spending in that category has changed in the last year. For example, Gasoline is 5.2% of an average consumer's spending, and it has risen 26% from 2007 to 2008.

As far as I can tell, this is actually a treemap, but in a new shape. More details pop-up when you mouse over each of the individual shapes.

Thanks to Tony, for sending in the link.

Wednesday
Mar122008

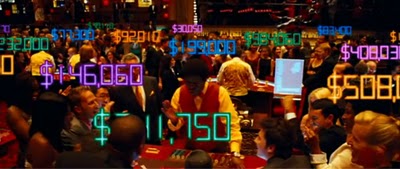
Ocean's Thirteen infographics


I can't upload the video (for obvious copyright reasons), but the movie Ocean's Thirteen uses some cool infographics to show the real-time winnings at each table in the casino.

Wednesday
Jan162008

The Price of Gasoline

This image was real popular on Digg.com this week. It's hosted on tinypic.com, but there's no author listed.

I love simple infographics like this that use a visual metaphor to instantly get the point across. You can tell someone that the price of gas is comparable with Coke, but putting gas in the Coke signature bottle will get more people to understand the message.

My own reaction was probably the opposite of what the author intended. My first thought is "Coke costs how much?!?" I know there is a lot more expense in producing gasoline than there is in producing Coke. They must really be marking the price up a lot for brown sugar-water.

There is a similar analogy in the U.S. regarding bottled water. Some bottled water brands are now more expensive than gasoline! How is that possible?!?

Sunday
Sep092007

The Wealthiest Americans Ever


From the NYTimes in July 2007, an interactive infographic ranking the Wealthiest Americans after you convert their fortunes to today's dollars using the relative share of G.D.P.

Scrolling your pointer over the photos or the fortune amount shows more detail of the individual. Lots of black & white portraits! Only current rich folk Bill Gates and Warren Buffet made the list with color portraits.

Page 1 2 3