About
Randy Krum
President of InfoNewt.
Data Visualization and Infographic Design

Infographic Design

Infographics Design | Presentations
Consulting | Data Visualizations

DFW DataViz Meetup

Join the DFW Data Visualization and Infographics Meetup Group if you're in the Dallas/Fort Worth area!

Search the Cool Infographics site

Custom Search

Subscriptions:


Feedburner

The Cool Infographics® Gallery:

How to add the
Cool Infographics button to your:

Cool Infographics iOS icon

- iPhone
- iPad
- iPod Touch


Read on Flipboard for iPad and iPhone

Featured in the Tech & Science category

Flipboard icon

Twitter Feed
From the Bookstore

Caffeine Poster

The Caffeine Poster infographic

Entries in web (190)

Thursday
Mar062008

Design Journal interview


Design Journal is the magazine for members of The Society of News Design (SND). The Editor, Jonathon Berlin, approached me a while back for a quick interview to include in an upcoming issue. The interview was just published in the Winter 2008 issue (#105), which has a whole theme about data and graphics.

Unfortunately, the magazine is for members of SND only. However...


...Jonathon also published most of the interview on the SND Update blog, so you can read the interview online.

Jonathon, thank you very much for the visibility and the press!

Friday
Feb082008

How many employees does Google have?

16,805 full-time employees worldwide as of December 31, 2007, Google says. Here on blogscoped.com visualized with one icon per person. It's a big image.

Found on Infosthetics.

Thursday
Feb072008

Social Media Building

Another infographic advertisement from Elliance.com to share around your office. How do the different Web2.0 services available today address the different needs within a company? An ideal graphic to share with the people in your organization that don't really understand how they can use these new web services.

Elliance is posting a weekly series of infographics on their site to help explain their services.

Tuesday
Feb052008

Search Engine Optimization

Elliance.com is posting a weekly series of infographics to help explain and advertise their SEO services. These graphics talk directly to corporate individuals that want better websites, but don't design websites themselves.

A great way to use infographics to talk to your target customers, and I think it shows how well Elliance knows their target audience.

Thanks Christy!

Saturday
Feb022008

The Life Cycle of a Blog Post


Wired magazine has this infographic flow chart of what happens after someone posts on their blog. From aggregators to text scrapers, your posts live a life of their own on the Internet.

You click Publish and lean back to admire your work. Imperceptibly and all but instantaneously, your post slips into a vast and recursive network of software agents, where it is crawled, indexed, mined, scraped, republished, and propagated throughout the Web.
It's on their multimedia section of the website, but the only multimedia aspect it has is zoom, which is a little disappointing.

Thanks Oliver for sending me the link!

Tuesday
Jan222008

Nichloas Felton's 2007 Annual Report


Nicholas Felton has published his new 2007 Annual Report. I love the way he breaks down his own personal life into maps and charts. I had just posted about his 2006 Annual Report last month.

Wednesday
Jan162008

Corporate Connections


I found reference to this graphic by Zohar Manor-Abel on smashingmagazine.com.

What is the connection between 3 celebrities, 35 corporations, 40 subsidiaries and more than 300 brands? Global business interests make up a complex network of connections between corporations from around the world. Corporate Connection, intends to shed light on 'who owns what' in the lobal marketplace and on the intricate nature of the world wide "business" web.

Thursday
Jan102008

Digg These Pics


Really cool new feature over on Digg.com. Back in late 2007, they added an Images category so users could digg their favorite pictures. Now they've added an interactive image viewer in the Digg Labs that lets you see new images and pictures being dugg in real-time.

The only thing I don't like is that it doesn't let you add any search terms. You have to see all of the activity, and can't narrow it down it all.

Wednesday
Jan022008

Savvygraph your Amazon product searches


I can't tell if Savvygraph.com is part of Amazon.com, or if this is a separate company running this. It takes any Amazon.com search terms you enter and charts the results on an X-Y chart showing the Average Rating and the total Number of Ratings.

It's fairly interactive. You can limit the price range using the sliders at the top, and when you hover over any of the pins you get the product image. Clicking on the pin takes you to that item on Amazon.com. Clicking on any of the links on the right limit the search to a smaller subset based on your choice (like a particular brand).

EDIT: I did receive an email from the author who confirmed that the site is totally separate from Amazon.com. Thanks Dave.

Thursday
Dec272007

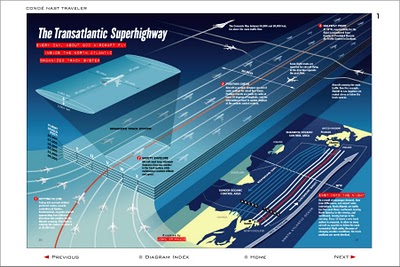
The Transatlantic Superhighway


I never really thought about it, but I'm sure the flight patterns over the Atlantic are actually this tightly controlled. Now the news that President Bush made some of the military flight paths available over the holidays makes more sense. The Transatlantic Superhighway is one of the diagrams on John Grimwade's Information Graphics site.