About
Randy Krum
President of InfoNewt.
Data Visualization and Infographic Design

Infographic Design

Infographics Design | Presentations
Consulting | Data Visualizations

DFW DataViz Meetup

Join the DFW Data Visualization and Infographics Meetup Group if you're in the Dallas/Fort Worth area!

Search the Cool Infographics site

Custom Search

Subscriptions:


Feedburner

The Cool Infographics® Gallery:

How to add the
Cool Infographics button to your:

Cool Infographics iOS icon

- iPhone
- iPad
- iPod Touch


Read on Flipboard for iPad and iPhone

Featured in the Tech & Science category

Flipboard icon

Twitter Feed
From the Bookstore

Caffeine Poster

The Caffeine Poster infographic

« Moviebarcodes: Whole Movies at a Single Glance | Main | The Present and Future State of Music »
Friday
Mar112011

What is Data Visualization?


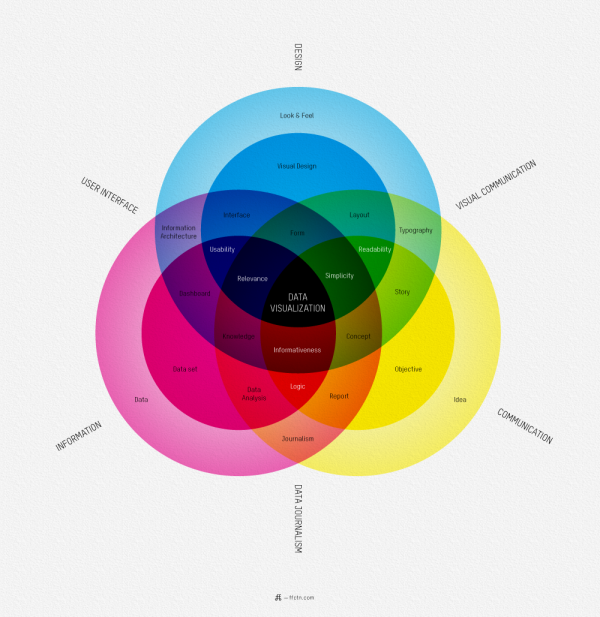
I love this map of What Is Data Visualization? from Sébastien Pierre, founder of ffunction.  It lays out the different aspects of information design, and acts as a fantastic guide to the vocabulary used in the design community.

ReadQWriteCloud has a good interview article with Pierre on his thoughts behind designing the infographic.

Pierre:

“Will it be interactive or static? Will it be used as a tool or to illustrate something? Depending on how we position the visualization, it will be more demanding on UI aspects or on visual aspects. Dashboards, online reports and interactive web visualizations need a solid understanding of UI design, while infographics and print reports require a strong foundation of typography, layout and visual communication.”

Found on ReadWriteCloud and ChartPorn

PrintView Printer Friendly Version

EmailEmail Article to Friend

Reader Comments (1)

I feel like a better map of what data visualization is would be a single giant circle with the word "snobbery" written in the center.
March 11, 2011 | Unregistered CommenterPatrick
Comments for this entry have been disabled. Additional comments may not be added to this entry at this time.