


App Store Wars infographic
 Randy
Randy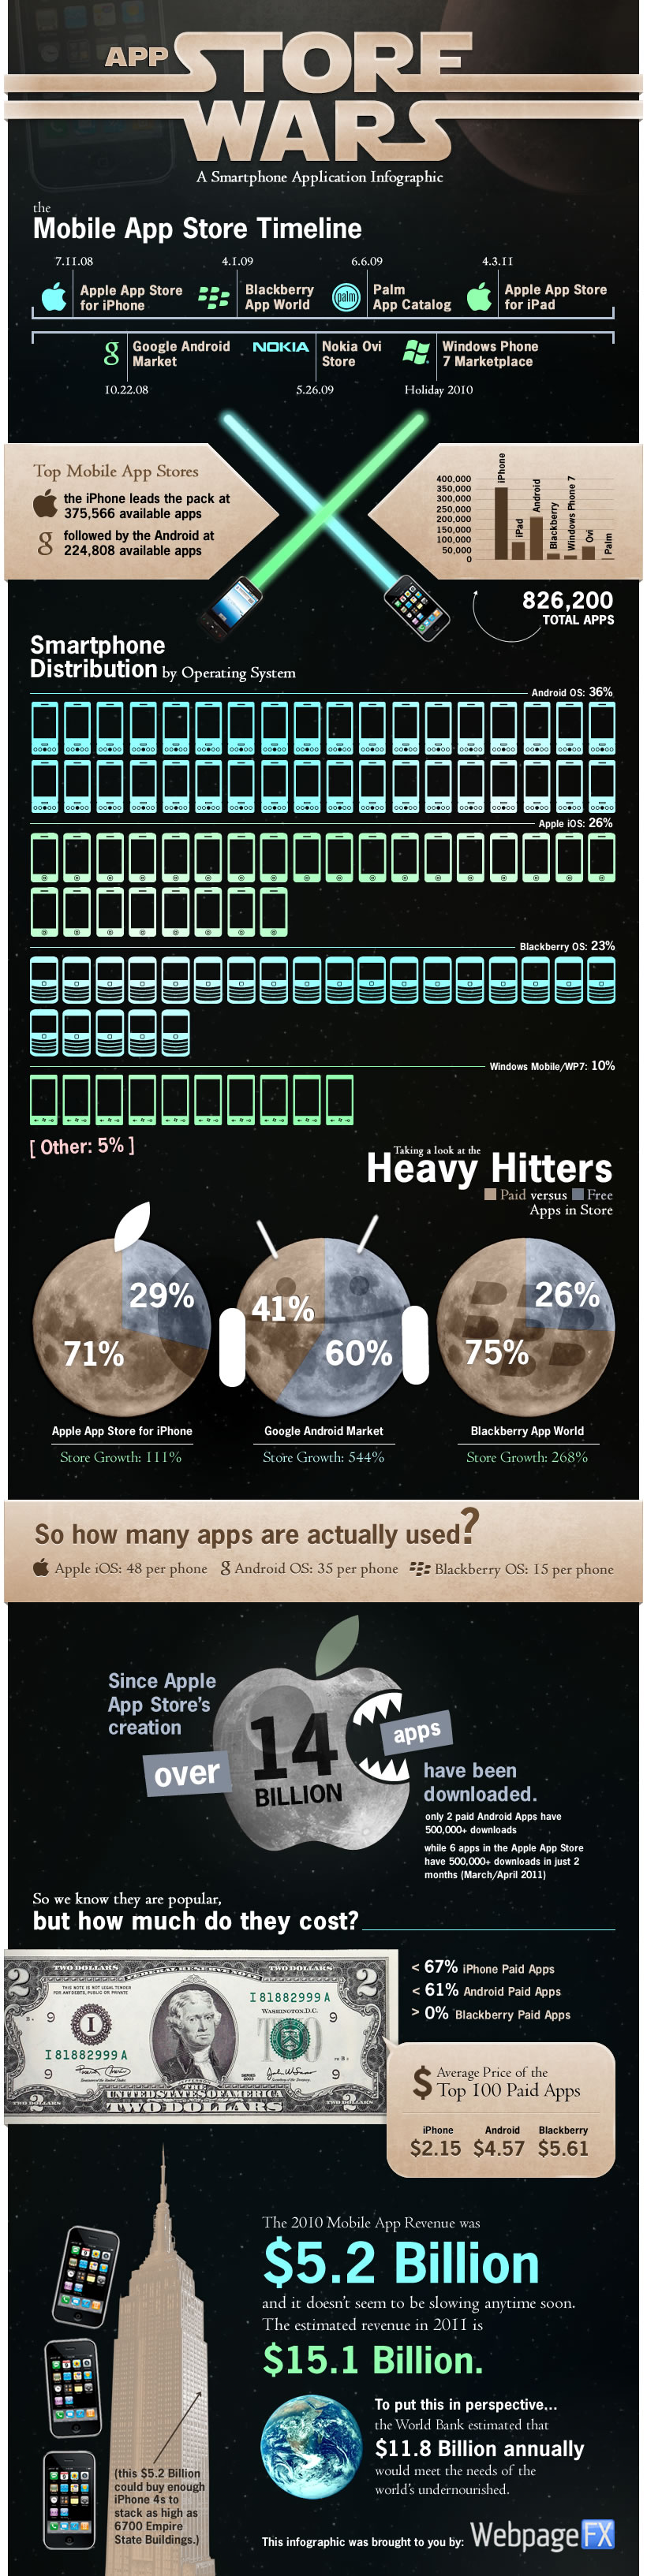
The App Store Wars infographic comes to us from WebpageFX.com and shows us a comparison between smartphone app stores available today.
We compared the Apple App Store, Android Market, Blackberry App World, and the Nokia, Palm and Windows Phone 7 application directories. Statistics include OS distribution, percentage of paid vs. free apps in each directory, average apps downloaded by device, average app cost, and total 2010 revenue from all apps sold.
A couple things I like and don’t like about thius design. Of course, I like the Star Wars reference in the design, and the timeline is simple and easy to comprehend.
I like the appropriate phone icons lined up to show the Smartphone Distribution, but it’s hard for the reader to understand when you line them up 18 across. We all think in base-10, so they should be 10 across, or even 20 if you want to make it that wide. Not 18.
I do think they missed a number of opportunities to visualize the comparisons when they only used numbers. Big numbers don’t qualify as a data visualization in a good infographic. How many apps used per phone? Average price paid per app on each phone platform? The total 2010 Mobile App Revunue comparisons to provide scale are lost without visualizations.
Thanks to Trevin for sending in the link. Also found on MacTrast!
