


A Marketer's Guide to Pinterest, Video and Infographic
 Randy
RandyThe Marketer’s Guide to Pintrest infographic video from MDG Advertising illustrates this hot new trend with this video that builds on their static infographic Pin It To Win It!
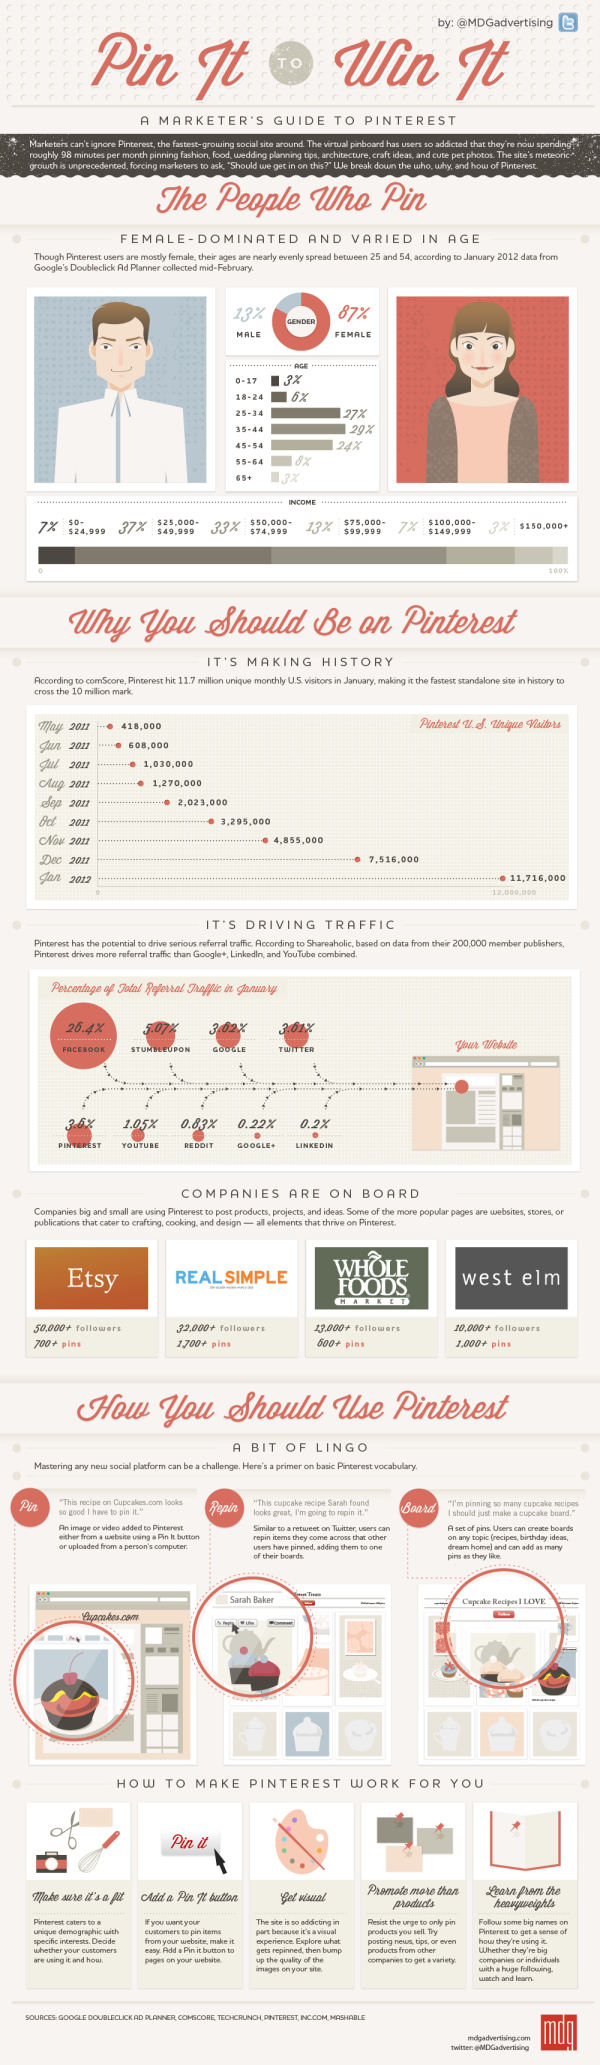
MDG Advertising has produced an engaging video highlighting the facts, figures, and findings from its popular “Pin It To Win It” infographic.
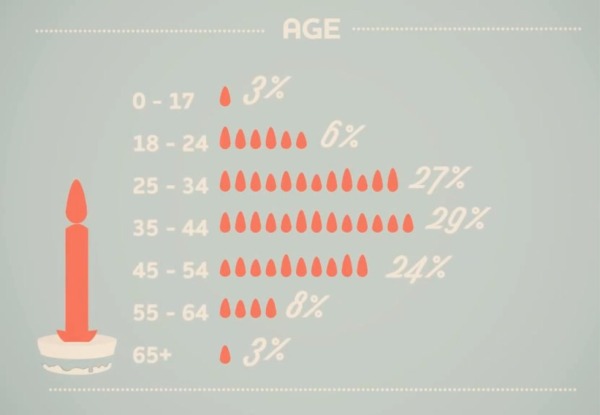
The video details the social site’s demographics, growth, and potential to drive abundant traffic to company websites. Pinterest is especially popular with the most highly coveted markets—about 60 percent are female and 80 percent are in the 25 to 54 age demographic. Plus, Pinterest drives more referral traffic than Google+, LinkedIn, and YouTube combined.
The video goes on to cover the brands, both large and small, on board the pinboard phenomenon, such as Whole Foods, Etsy, West Elm, and Real Simple. These companies reflect the cooking, décor, and crafts interests that are prevalent among the Pinterest audience.
In addition, the video helps marketers navigate Pinterest’s features and terminology by demonstrating the “pin,” “repinning,” and “board.” It also shows how companies can leverage Pinterest for maximum response and referral traffic, whether by improving their image quality or promoting more than just a product line.
Only a couple companies have begun to leverage the research and time put into developing a static infographic, by using that same data to produce an infographic video that reaches a whole new audience. It’s a very effective way to get the most out of the data research that was already done as part of designing the original infographic.
The most disappointing thing is that whoever did the video production got the data visualizations wrong. Since when is 6 six times as big as 3? And 27 only twice as big as 6?
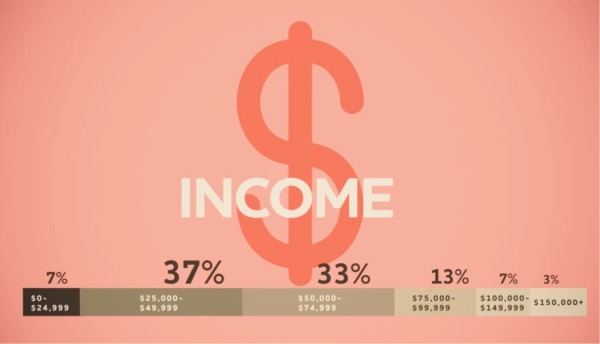
3% and 7% sections of the stacked bar can’t be the same size. In fact, 3% looks a little bit bigger to make room for the text.
Here’s the original static infographic, Pin It To Win It, where they got the data visualizations correct. I’m guessing that the infographic designer was not involved in the video production.
Thanks to MDG Advertising for sending in the link! Also found on Daily Infographic and The Infographic Showcase.

Reader Comments (1)
Thanks for sharing our video and infographic. We also appreciate the kudos on generating both an infographic and video from the research data. You're absolutely correct regarding the visualizations. The numbers and stats are accurate but fair point regarding the relative sizing of the visuals. Sometimes what works in a static doesn't translate as well in video and we make some changes but fair point that they should still portray the intended proportions.
Jeff - MDG Advertising