About
Randy Krum
President of InfoNewt.
Data Visualization and Infographic Design

Infographic Design

Infographics Design | Presentations
Consulting | Data Visualizations

DFW DataViz Meetup

Join the DFW Data Visualization and Infographics Meetup Group if you're in the Dallas/Fort Worth area!

Search the Cool Infographics site

Custom Search

Subscriptions:


Feedburner

The Cool Infographics® Gallery:

How to add the
Cool Infographics button to your:

Cool Infographics iOS icon

- iPhone
- iPad
- iPod Touch


Read on Flipboard for iPad and iPhone

Featured in the Tech & Science category

Flipboard icon

Twitter Feed
From the Bookstore

Caffeine Poster

The Caffeine Poster infographic

« The Process of Designing an Infographic | Main | The Fallen of World War II »
Monday
Jun012015

A World of Languages

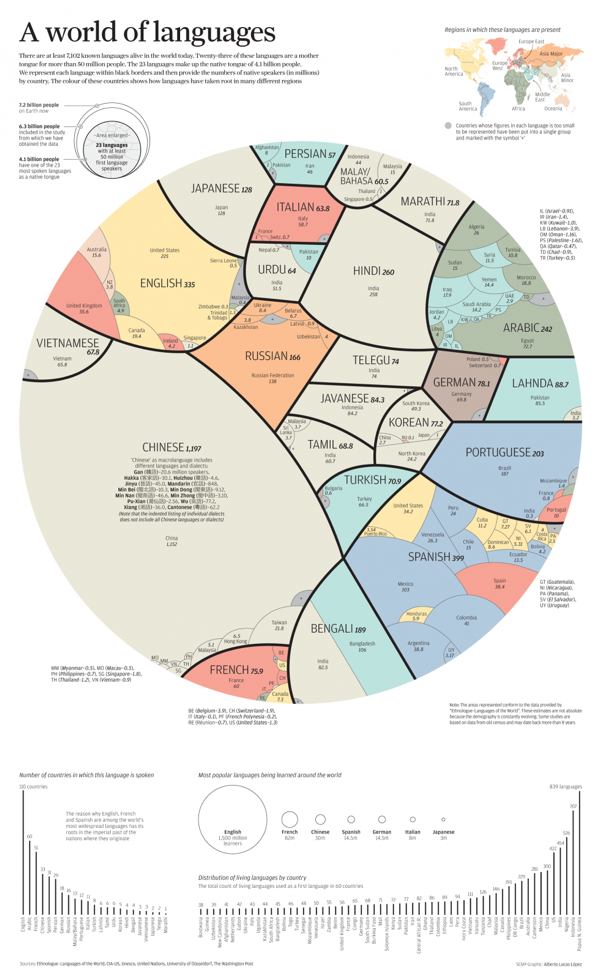
A World of Languages infographic

A World of Languages - and How Many Speak Them is a new infographic by Alberto Lucas López for the South China Morning Post that compares the number of people that speak the top 23 languages in the world as their primary language. High resolution image version available HERE.

There are at least 7,102 known languages alive in the world today. Twenty-three of these languages are a mother  tongue for more than 50 million people. The 23 languages make up the native tongue of 4.1 billion people. We represent each language within black borders and then provide the numbers of native speakers (in millions)  by country. The colour of these countries shows how languages have taken root in many different regions

The dominant visual centerpiece appears to be a combination of a voronoi diagram & circular treemap, where the area of each section is representative of the number of people that speak each language as their first language. I don’t know any any software that will create this specific visualization style, so I’m assuming the area of each section had to be calculated separately. With the different, organic shapes how were those areas calculated? Iteration?

The data is a little bit controversial. It’s an estimate of the number of people that speak each language as their first language. There’s no accounting for multi-lingual people or language families. I love the data visualization design, but the underlying data may cause some concern.

PrintView Printer Friendly Version

EmailEmail Article to Friend

Reader Comments (5)

So, for portuguse for example, Angola with about 20million dont enven register and also for the 20milion of mocambique, also Brasil in itself is more than 200milion. Where the hell did he came up with this data?
June 1, 2015 | Unregistered CommenterPedro Djalo
I'd love to know how that was created and the graphical size of each "language" calculated. Granted, the data seems like it could use further explanation, but the graphic is beautiful.
January 5, 2016 | Unregistered CommenterJustin
1 million speaker of Italian (as their first language) in France ?
What is this joke ?
June 23, 2017 | Unregistered CommenterStemp
A joke ? Well, I don't find it unlikely ... https://en.wikipedia.org/wiki/Italians_in_France
June 26, 2017 | Unregistered CommenterSophie
When did ‘Landha’ becomes the term for all speakers of ‘Punjabi dialects’ ? ( ‘all’ judging by the population total).
September 23, 2018 | Unregistered CommenterGlen Binnie
Editor Permission Required
While we are migrating to a new site design, you must have editing permission for this entry in order to post comments.