10 Infographics and Visualization Apps for iOS
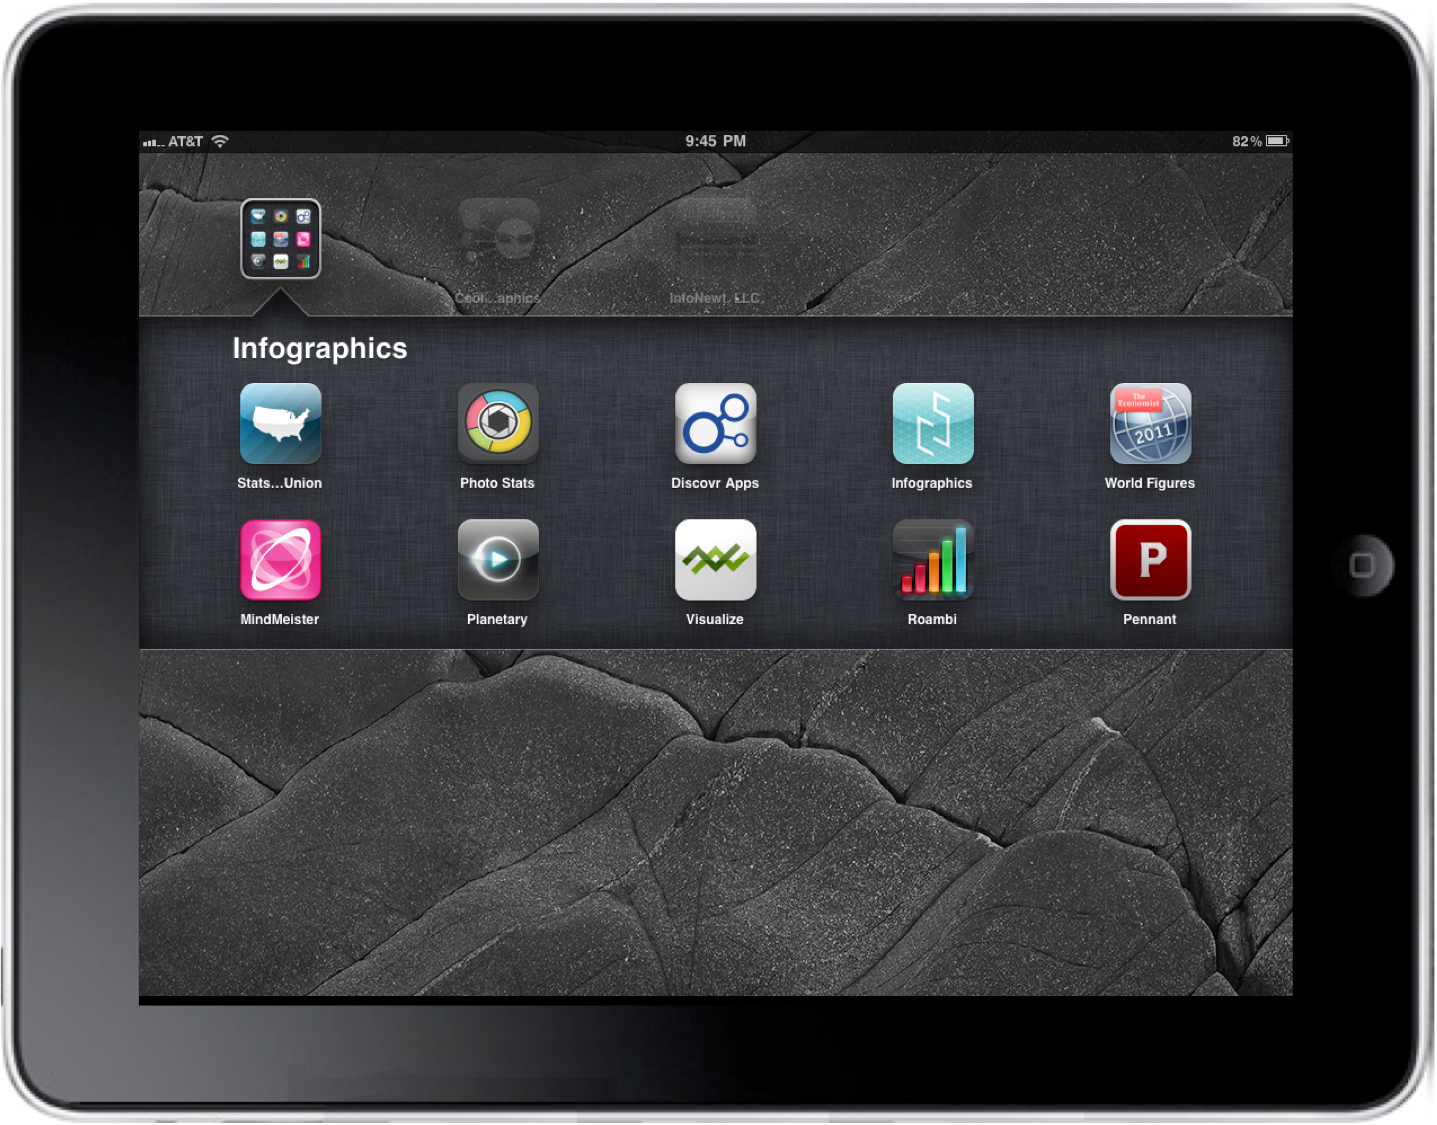
As infographics continue to evolve and grow in popularity, so do the different ways we can view them. A bunch of infographic specific apps have begun showing up on mobile devices. The functions of these apps include viewing world statistics, infographic design portfolios, company dashboards, creating mind maps, finding new apps and exploring your music collection visually.
Today we look at 10 Infographic Apps for iOS devices (in no particular order):
 1. Stats of the Union (FREE)
(iPad ONLY)
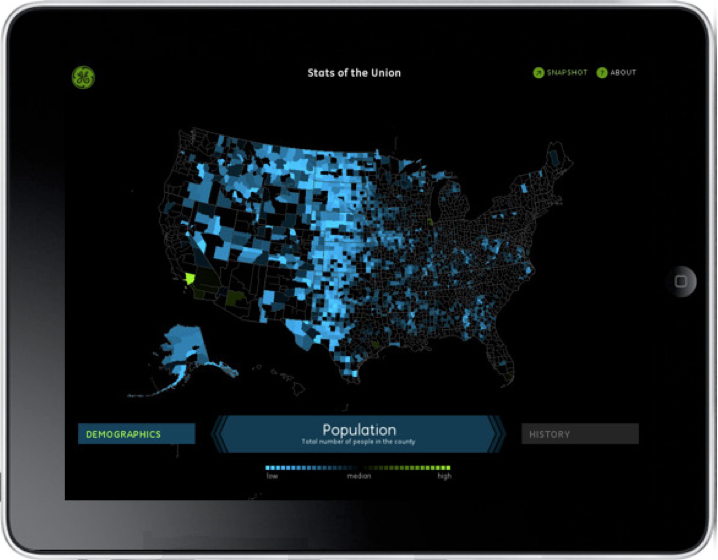
Stats of the Union is a data visualization app from Ben Fry, Fathom Information Design and GE. Summarizing the census data by county, you can easily explore Births, Deaths, Diseases, Demographics, etc.
Explore the nation’s vital signs―from life expectancy to access to medical care―and make your own conclusions about America’s health. See a stat you’d like to share? Save it as a snapshot.
Stats of the Union is powered by the Community Health Status Indicators (CHSI) report, which consists of data from federal agencies including the Census Bureau, Department of Health & Human Services, Department of Labor and the Environmental Protection Agency.
 2. Photo Stats ($0.99)
(iPhone, iPad and iPod Touch)
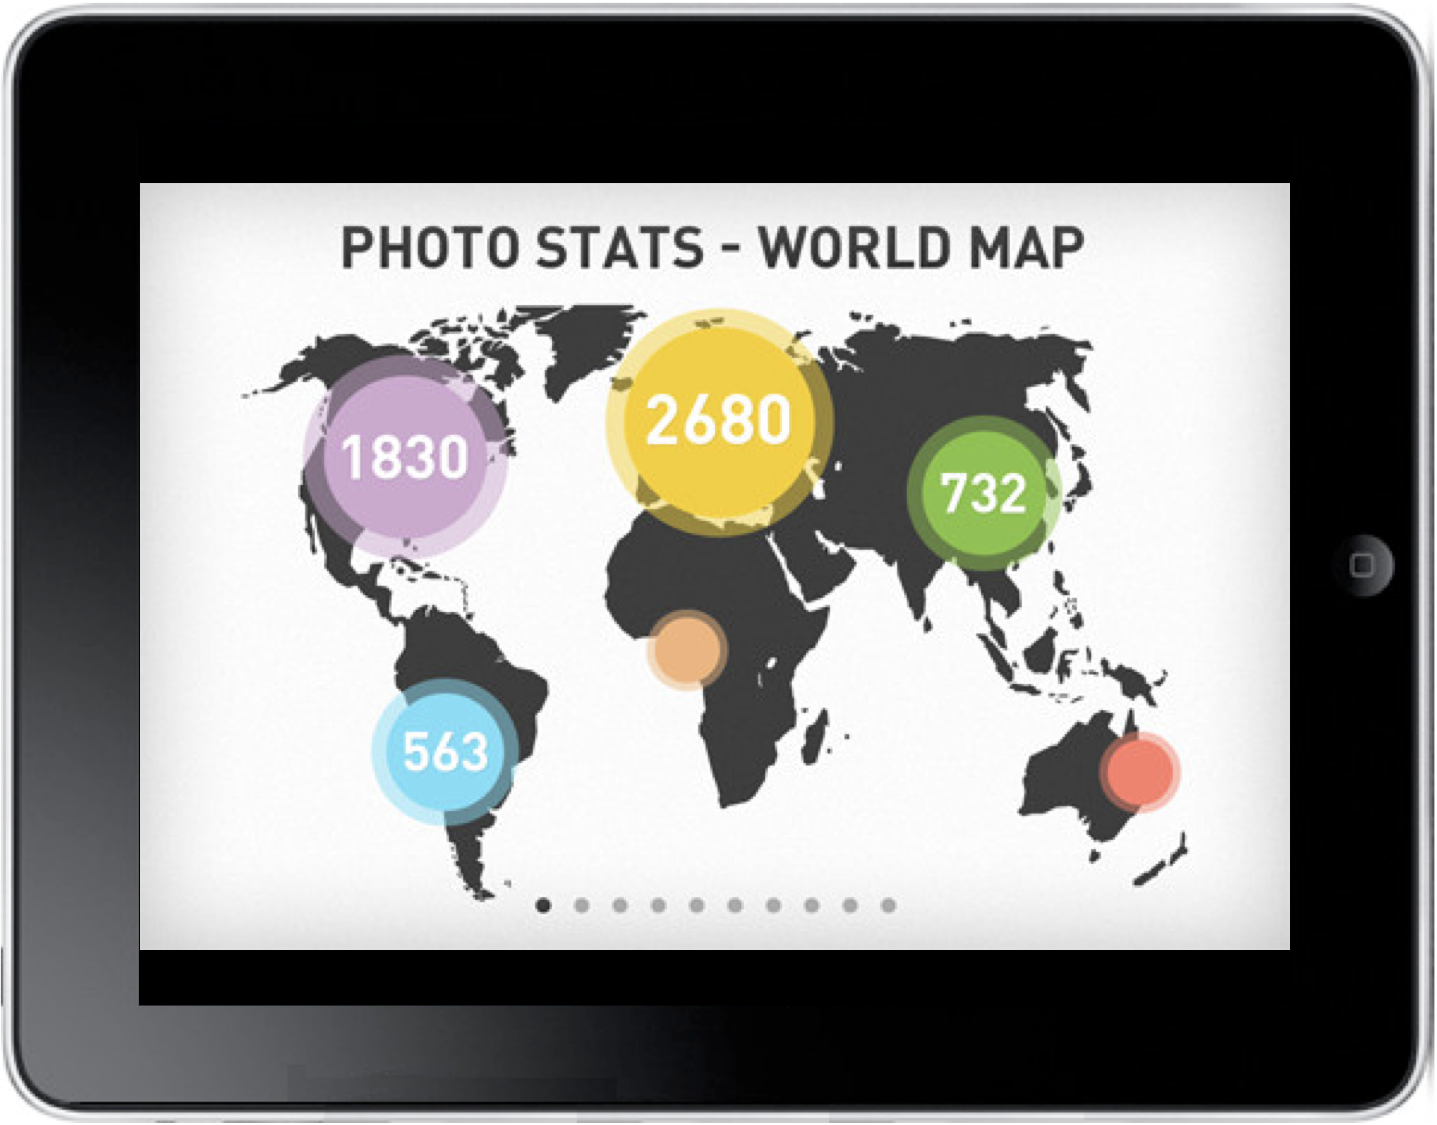
A very cool app from Dear Future Astronaut AB. The Photo Stats app analyzes all of the photos on your iDevice and creates 11 different personal visualizations using the meta data of the photos. Then, with the click of a button, it will combine these data visualizations into one cohesive infographic that you can save or post directly to Facebook or Twitter.
Create cool infographics about how, when and where you take photos on iPhone. Visualize your iPhoneography habits, learn how to make better photos and show off photo skills to your friends.
 3. Discovr Apps ($0.99)
(iPhone, iPad and iPod Touch)
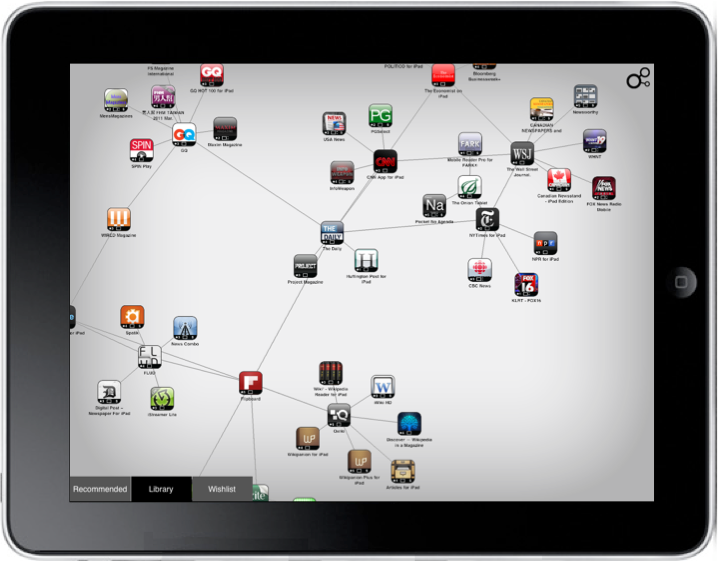
Discovr Apps is a great, interactive mind map of related iOS apps, and works as a discovery tool to find new apps. Starting with one of your exisiting apps, the recommended apps or using the search, the app shows you related apps. Tap any of the to expand the related apps, and continue to explore deeper into any app displayed on the screen.
The author, Jammbox, has applied this same exploration user interface to Music with Discovr Music ($1.99) to find similar music and artists.
Simply search for an app that you like or choose from one of our featured apps. We’ll show you how the apps you choose are connected in a massive, never-ending map of the App Store, and we’ll give you great recommendations for other apps to download.
When you find an app you like you can read the app descriptions, check out the screenshots and ratings, or buy it directly from the App Store. You can also share your favorite apps and maps with your friends via Twitter, Facebook or email.
 4. Infographics, by Column Five Media (FREE)
(iPhone, iPad and iPod Touch)
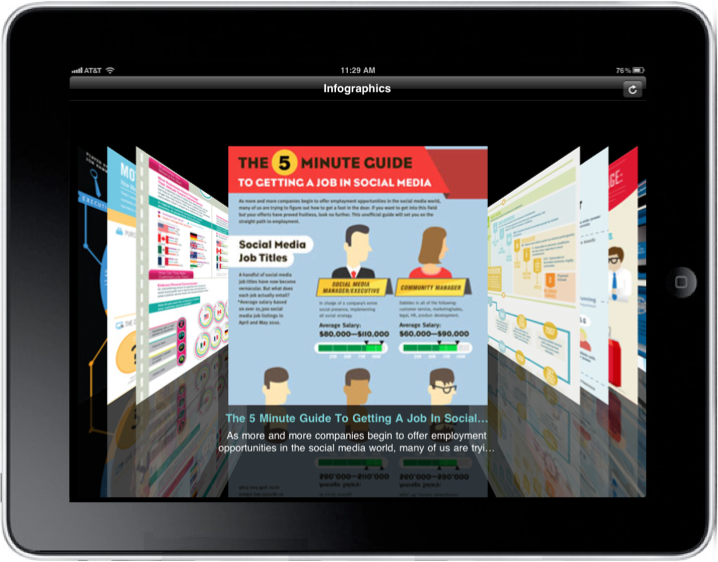
From the infographic design firm, Column Five Media, the Infographics app is a visual portfolio showcasing many of their designs. I love the coverflow mode when you view the list in landscape.
We have really appreciated everyone who is staying connected through our Infographics newsletter, and we are happy to bring fresh infographics to you for the iPad and iPhone with our brand new Infographics app, which you can download for free. If you have a chance to check it out on an iPad, that is definitely the way to go for the best browsing experience, but the iPhone version will give you some mobile eye candy as well. This is version 1.0 and there are a lot of new features in the works along with a version for Droid coming soon.
 5. The Economist World in Figures 2011 Edition ($0.99)
(iPhone, iPad and iPod Touch)
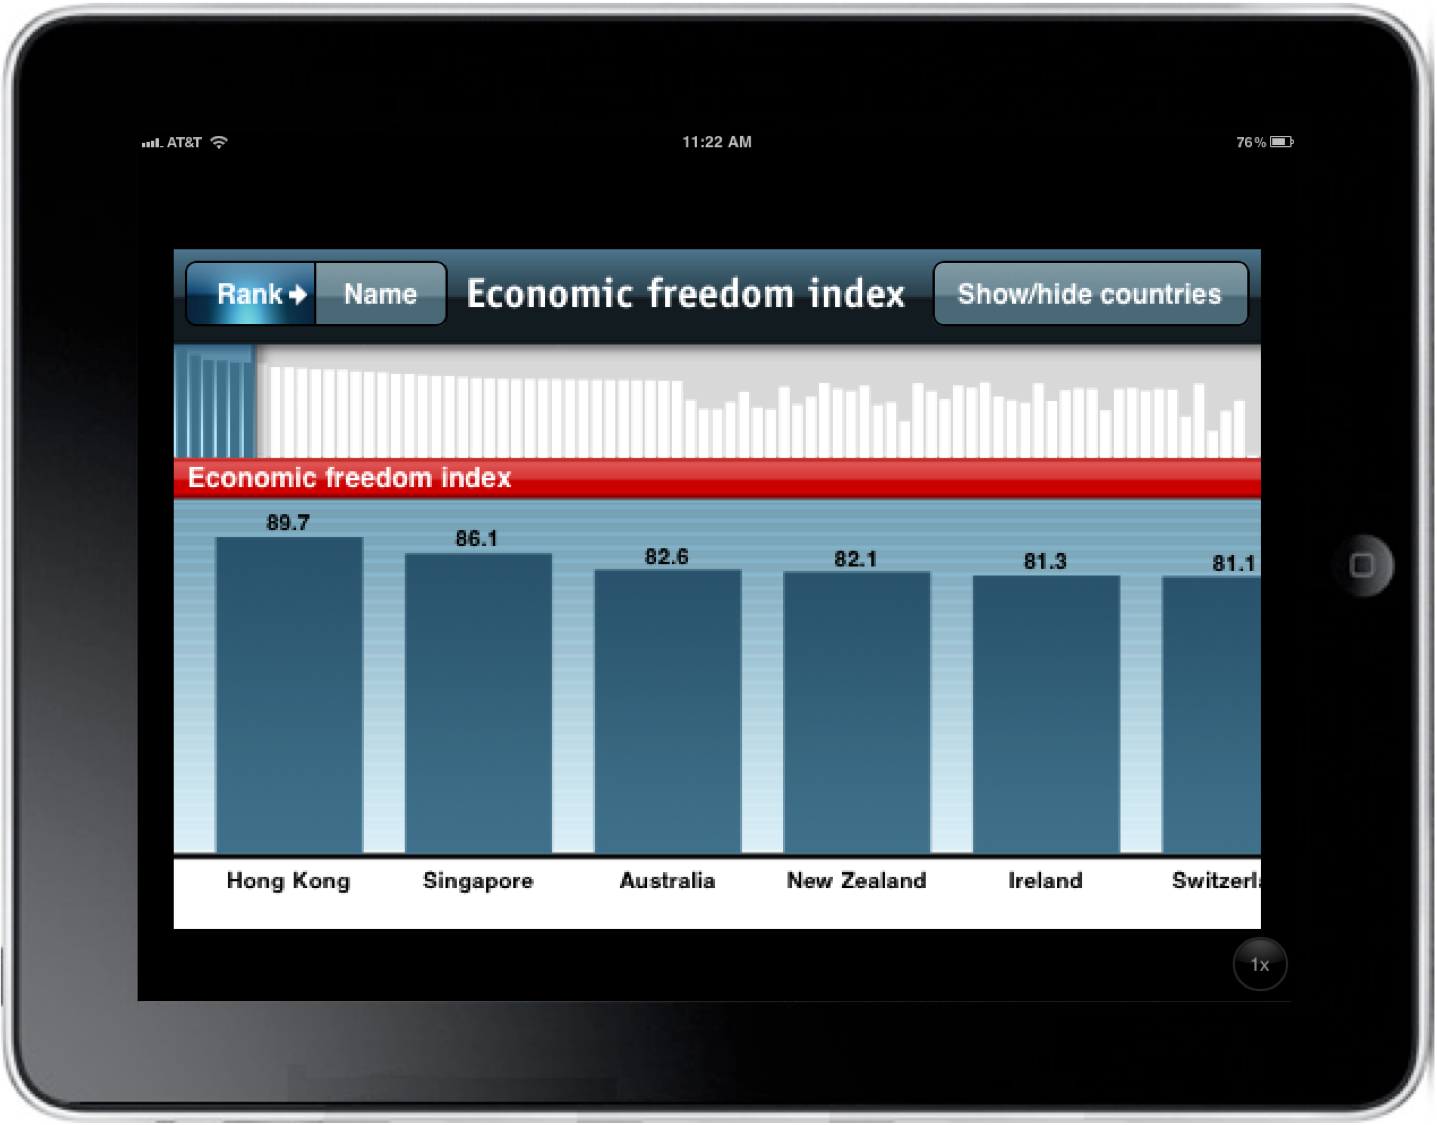
From a collaboration between The Economist and XPLANE | Dachis Group, comes The World in Figures 2011 Edition. This app lets the user view global data and compare world statistics between countries.
“The process definitely challenged our designers, making us consider new ways to enhance functionality around how data was being presented, while also fostering intuitive interaction between the user and the application,” said Parker Lee, executive vice president, global account services, Dachis Group. “The end result really does put a new face on information.”
6. MindMeister for iPad ($7.99) or MindMeister for iPhone (FREE)
(iPhone, iPad and iPod Touch)
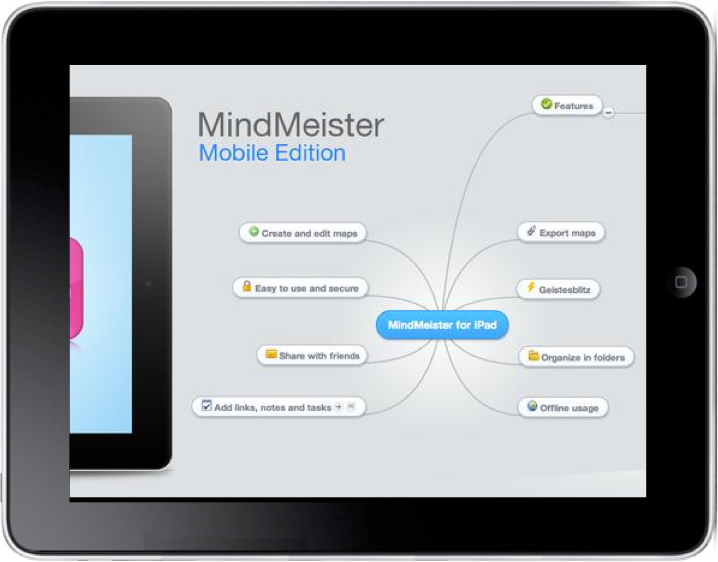
MindMeister started as an online mind mapping service that allows you to build, collaborate and share mind maps online. With the iOS apps you can access your online maps and edit them from your mobile device. Works with a free MindMeister account, but more features are available to members of MindMeisterPro.
Easily create, view and edit conceptual mind maps from this intuitive app, and then share them with friends and colleagues online. Automatic synchronization with the online MindMeister service ensures that your creations are with you wherever you go. This sync allows you to continue working on your ideas in our award-winning and full-featured web interface, on your own or together with your friends.
7. Planetary (FREE)
(iPad ONLY)
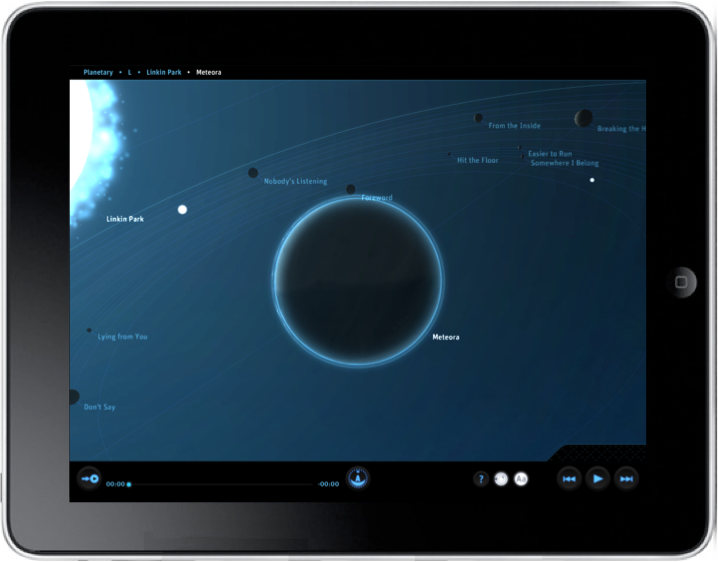
Planetary is a very cool app that visualizes your entire music library (as loaded on your iPad) as a galaxy. Stars are artist, planets are albums and moon are individual tracks. You can playback the tracks from the app, so it also makes a good visualizer. They even did the calculations to base each moon’s speed on it’s track length, so when you play a song it lasts one complete orbit. There a lot more behind the scenes information on the Bloom Blog.
Planetary is an all-new, stunningly beautiful way to explore your music collection, available only on iPad. Fly through a 3D universe dynamically created by information about the recording artists you love. Visit planets that represent your favorite albums and control the playback of your music on iPad by browsing and selecting astronomical objects.
8. Adobe SiteCatalyst Visualize (FREE*)
(iPad ONLY)
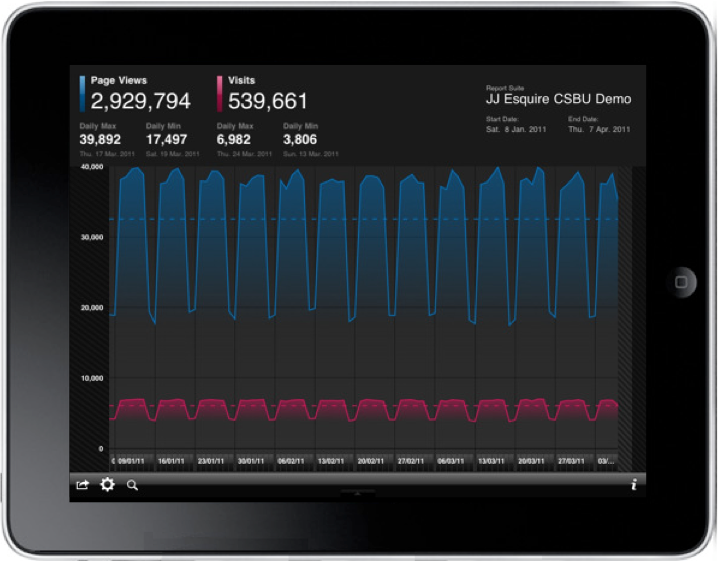
This only works if you are an existing Adobe SiteCatalyst customer (which isn’t free), but if you are, the Adobe SiteCatalyst Visualize app will allow you to explore your web stats in a handful of different, visual ways.
Adobe SiteCatalyst Visualize enables active data exploration via trend analysis of key metrics. Business analysts and marketers can use “multi-touch” capabilities to zoom and focus on specific data points within the last 90 days. In addition, using a visual “word cloud” of the most frequently selected metrics, marketers can easily add or change metrics to customize the presentation of data. Finally, marketers can easily share the analysis by sending report views via email or connecting to an external display for presentations.
*Please Note: You must be an existing Adobe SiteCatalyst customer with valid login privileges to use the application.
 9. Roambi - Visualize (FREE)
(iPhone, iPad and iPod Touch)
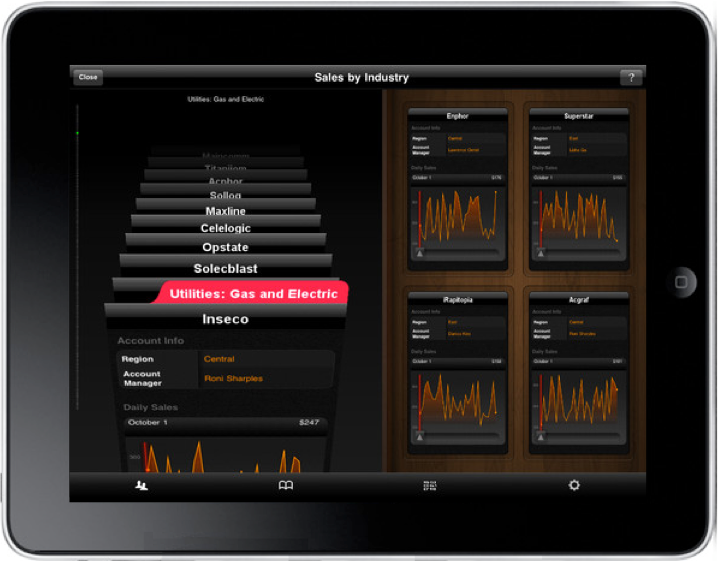
Roambi - Visualize is a mobile dashboard app that lets you explore different business reports and data visualizations. You can view data from Microsoft Excel or CSV/HTML data sources for free, or there are a couple paid levels of the Roambi Publishing Service that offer many more data source options.
Roambi is an innovative app that quickly transforms your business reports and data – from many popular business applications – into secure, interactive mobile dashboards, instantly delivered to any iPhone or iPad. It lets you easily view and interact with up-to-the-minute company information – giving you the insight you need for on-the-go analysis, impromptu presentations and smart decision-making. Roambi puts the pulse of your business, in the palm of your hand.
 10. Pennant ($4.99)
(iPad ONLY)
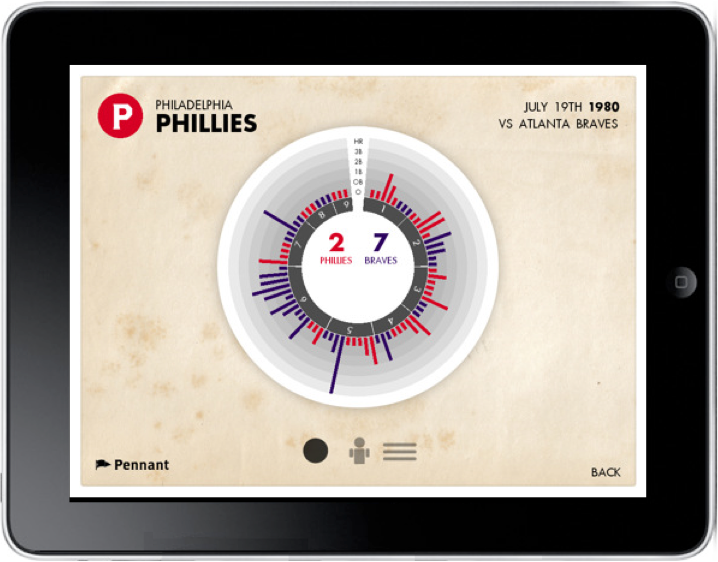
Pennant is a beautiful app that visualizes over 50 years of baseball history (from 1952-2010) with some beautiful visual designs.
Pennant is an interactive history of baseball like none other seen before. Using Pennant’s rich interface fans can browse and view data from over 115,000 games that have taken place from 1952 to 2010. For more info as well as a video preview please visit http://www.pennant.cc
Did I miss any that I should include in a future post? This is absolutely only the beginning, so expect to see more in the future.


 Randy
Randy